
House Prices in Cockbrook
House prices in Cockbrook have an overall average of £183,316 over the last year.
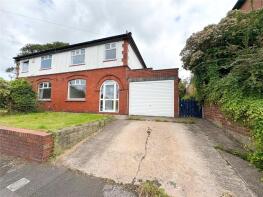
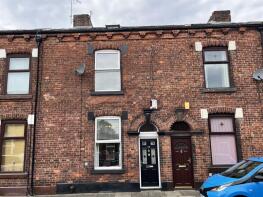
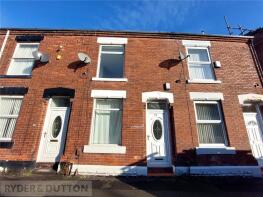
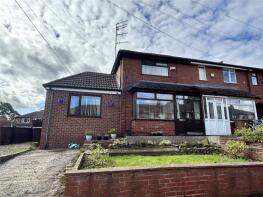
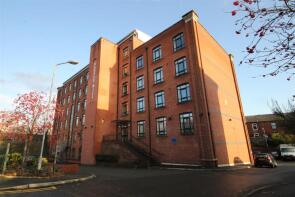
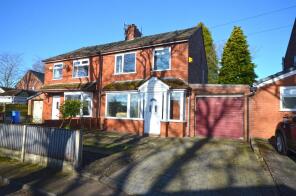
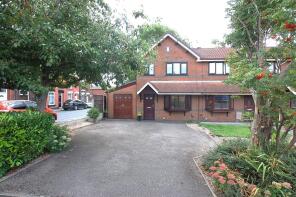
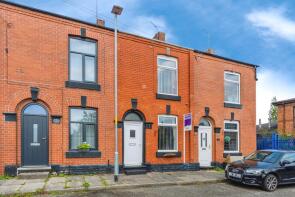
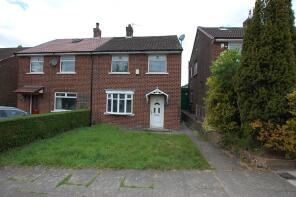
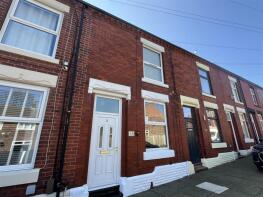
The majority of properties sold in Cockbrook during the last year were terraced properties, selling for an average price of £173,866. Semi-detached properties sold for an average of £249,250, with flats fetching £105,400.
Overall, the historical sold prices in Cockbrook over the last year were 1% down on the previous year and 5% down on the 2022 peak of £193,111.
Properties Sold
9, Sutherland Street, Ashton-under-lyne OL6 6RR

| Today | See what it's worth now |
| 10 Apr 2026 | £193,000 |
| 22 Aug 2022 | £181,000 |
26, Currier Lane, Ashton-under-lyne OL6 6TE

| Today | See what it's worth now |
| 3 Apr 2026 | £160,000 |
| 10 Mar 2006 | £128,000 |
No other historical records.
28, Neal Avenue, Ashton-under-lyne OL6 6PA
| Today | See what it's worth now |
| 6 Mar 2026 | £237,000 |
| 5 Oct 2012 | £123,000 |
No other historical records.
35, Granville Street, Ashton-under-lyne OL6 6TS
| Today | See what it's worth now |
| 6 Mar 2026 | £192,500 |
| 13 Feb 1998 | £36,000 |
No other historical records.
23, Queen Street, Ashton-under-lyne OL6 6NW

| Today | See what it's worth now |
| 26 Feb 2026 | £142,500 |
| 10 Jul 2020 | £100,000 |
94, Crawford Street, Ashton-under-lyne OL6 6TT
| Today | See what it's worth now |
| 23 Feb 2026 | £139,500 |
| 13 May 2022 | £132,000 |
1, Rutland Street, Ashton-under-lyne OL6 6SB
| Today | See what it's worth now |
| 6 Feb 2026 | £184,000 |
| 20 Dec 1999 | £41,000 |
30, Harper Mill, Mossley Road, Ashton-under-lyne OL6 6QE
| Today | See what it's worth now |
| 2 Feb 2026 | £110,800 |
| 7 Jul 2005 | £124,500 |
No other historical records.
10, Bowman Crescent, Ashton-under-lyne OL6 6PY
| Today | See what it's worth now |
| 30 Jan 2026 | £215,000 |
No other historical records.
74, Arundel Street, Ashton-under-lyne OL6 6RG

| Today | See what it's worth now |
| 30 Jan 2026 | £76,000 |
| 17 Jun 2011 | £163,000 |
4, Dysart Street, Ashton-under-lyne OL6 6TU
| Today | See what it's worth now |
| 16 Jan 2026 | £180,500 |
| 14 May 2021 | £150,000 |
8, Arundel Street, Ashton-under-lyne OL6 6RD
| Today | See what it's worth now |
| 16 Jan 2026 | £152,500 |
| 29 Nov 2024 | £147,250 |
1, Marshall Court, Ashton-under-lyne OL6 6YA
| Today | See what it's worth now |
| 9 Jan 2026 | £250,000 |
No other historical records.
62, Audley Street, Ashton-under-lyne OL6 6RB
| Today | See what it's worth now |
| 12 Dec 2025 | £185,000 |
No other historical records.
23, Corkland Close, Ashton-under-lyne OL6 6SA
| Today | See what it's worth now |
| 12 Dec 2025 | £135,000 |
| 14 Mar 2013 | £75,000 |
No other historical records.
81, Cowhill Lane, Ashton-under-lyne OL6 6HH
| Today | See what it's worth now |
| 10 Dec 2025 | £150,000 |
| 10 Mar 2023 | £122,000 |
41, Stamford Square, Ashton-under-lyne OL6 6SH
| Today | See what it's worth now |
| 2 Dec 2025 | £174,750 |
| 10 May 2021 | £95,000 |
No other historical records.
36, Arundel Street, Ashton-under-lyne OL6 6RG
| Today | See what it's worth now |
| 28 Nov 2025 | £185,000 |
| 26 May 2017 | £78,000 |
No other historical records.
5, Sloane Street, Ashton-under-lyne OL6 6NR
| Today | See what it's worth now |
| 7 Nov 2025 | £147,000 |
| 15 Jun 2012 | £71,500 |
49, Audley Street, Ashton-under-lyne OL6 6RB

| Today | See what it's worth now |
| 31 Oct 2025 | £144,000 |
No other historical records.
41, Hutton Avenue, Ashton-under-lyne OL6 6QY
| Today | See what it's worth now |
| 23 Oct 2025 | £157,000 |
| 19 Apr 2007 | £129,000 |
77, Stamford Street East, Ashton-under-lyne OL6 6QQ

| Today | See what it's worth now |
| 2 Oct 2025 | £200,000 |
| 17 Nov 2023 | £227,000 |
7, Deramore Close, Ashton-under-lyne OL6 6RN
| Today | See what it's worth now |
| 2 Oct 2025 | £340,000 |
| 5 Nov 2014 | £160,000 |
No other historical records.
Source Acknowledgement: © Crown copyright. England and Wales house price data is publicly available information produced by the HM Land Registry.This material was last updated on 9 July 2026. It covers the period from 1 January 1995 to 30 April 2026 and contains property transactions which have been registered during that period. Contains HM Land Registry data © Crown copyright and database right 2026. This data is licensed under the Open Government Licence v3.0.
Disclaimer: Rightmove.co.uk provides this HM Land Registry data "as is". The burden for fitness of the data relies completely with the user and is provided for informational purposes only. No warranty, express or implied, is given relating to the accuracy of content of the HM Land Registry data and Rightmove does not accept any liability for error or omission. If you have found an error with the data or need further information please contact HM Land Registry.
Permitted Use: Viewers of this Information are granted permission to access this Crown copyright material and to download it onto electronic, magnetic, optical or similar storage media provided that such activities are for private research, study or in-house use only. Any other use of the material requires the formal written permission of Land Registry which can be requested from us, and is subject to an additional licence and associated charge.
Rightmove takes no liability for your use of, or reliance on, Rightmove's Instant Valuation due to the limitations of our tracking tool listed here. Use of this tool is taken entirely at your own risk. All rights reserved.