
House Prices in Copeland
House prices in Copeland have an overall average of £183,436 over the last year.
The majority of properties sold in Copeland during the last year were terraced properties, selling for an average price of £121,437. Semi-detached properties sold for an average of £170,751, with detached properties fetching £318,875.
Overall, the historical sold prices in Copeland over the last year were similar to the previous year and 6% up on the 2022 peak of £173,712.
Properties Sold
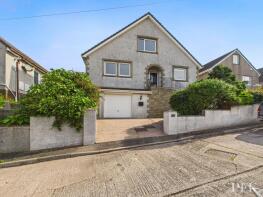
10, Holly Bank, Whitehaven CA28 6SA
| Today | See what it's worth now |
| 24 Apr 2026 | £162,000 |
| 30 Jul 2010 | £145,000 |
1, Harrier Court, Whitehaven CA28 8YS
| Today | See what it's worth now |
| 24 Apr 2026 | £248,000 |
| 20 Jun 2013 | £202,500 |
5, Goldsmith Road, Egremont CA22 2HL

| Today | See what it's worth now |
| 23 Apr 2026 | £106,000 |
| 13 Apr 2022 | £94,000 |
No other historical records.
6, Cleator Moor Road, Whitehaven CA28 8RZ
| Today | See what it's worth now |
| 23 Apr 2026 | £148,000 |
| 18 May 2022 | £115,000 |
No other historical records.
47, Norbeck Park, Cleator Moor CA25 5RL
| Today | See what it's worth now |
| 17 Apr 2026 | £138,000 |
| 20 Jan 2023 | £125,000 |
16, Highland View, Bransty Road, Whitehaven CA28 6HF
| Today | See what it's worth now |
| 17 Apr 2026 | £160,000 |
| 9 Mar 2018 | £113,000 |
23, Hollins Park, Moor Row CA24 3LQ

| Today | See what it's worth now |
| 17 Apr 2026 | £180,000 |
| 11 Feb 2021 | £124,000 |
66, Penzance Street, Moor Row CA24 3JH

| Today | See what it's worth now |
| 17 Apr 2026 | £87,000 |
| 13 Mar 2020 | £70,000 |
4, Whitehaven Road, Cleator Moor CA25 5QN
| Today | See what it's worth now |
| 16 Apr 2026 | £95,000 |
| 18 Oct 2021 | £81,000 |
8, Gatesyde Place, Holmrook CA19 1UD

| Today | See what it's worth now |
| 15 Apr 2026 | £295,000 |
| 10 Nov 2020 | £190,000 |
102, Albert Street, Millom LA18 4AD
| Today | See what it's worth now |
| 14 Apr 2026 | £83,500 |
| 18 May 2021 | £69,500 |
49, Arlecdon Park Road, Frizington CA26 3XG
| Today | See what it's worth now |
| 10 Apr 2026 | £80,000 |
| 15 Apr 2016 | £73,000 |
Winterbourne, Asby Lane, Workington CA14 4RT

| Today | See what it's worth now |
| 10 Apr 2026 | £275,000 |
| 12 Dec 2016 | £297,875 |
163, Mill Hill, Cleator Moor CA25 5SB

| Today | See what it's worth now |
| 9 Apr 2026 | £220,000 |
| 11 Jan 2018 | £95,000 |
No other historical records.
32, Asby Road, Workington CA14 4RZ
| Today | See what it's worth now |
| 8 Apr 2026 | £166,000 |
| 8 Nov 2021 | £158,000 |
No other historical records.
86, Trumpet Terrace, Cleator CA23 3DX
| Today | See what it's worth now |
| 8 Apr 2026 | £95,000 |
| 3 Aug 2007 | £75,000 |
Force Bank, Santon Bridge, Holmrook CA19 1UY
| Today | See what it's worth now |
| 7 Apr 2026 | £400,000 |
| 14 Dec 2018 | £297,000 |
24, Woodstock Lane, Whitehaven CA28 7BH
| Today | See what it's worth now |
| 7 Apr 2026 | £330,000 |
| 30 Sep 2008 | £249,000 |
No other historical records.
7, Bankend View, Egremont CA22 2TH
| Today | See what it's worth now |
| 2 Apr 2026 | £142,500 |
| 6 Aug 2012 | £112,500 |
72, Wellington Street, Millom LA18 4DQ
| Today | See what it's worth now |
| 2 Apr 2026 | £83,000 |
| 15 Aug 2024 | £34,000 |
19, The Oval, Whitehaven CA28 9TD

| Today | See what it's worth now |
| 2 Apr 2026 | £110,000 |
| 10 Mar 2006 | £69,000 |
No other historical records.
3, Royal Drive, Egremont CA22 2LG
| Today | See what it's worth now |
| 2 Apr 2026 | £102,000 |
| 11 Jan 2013 | £44,000 |
14, Heathcote Park, Cleator Moor CA25 5HL
| Today | See what it's worth now |
| 31 Mar 2026 | £185,000 |
| 12 Oct 2007 | £169,950 |
No other historical records.
Source Acknowledgement: © Crown copyright. England and Wales house price data is publicly available information produced by the HM Land Registry.This material was last updated on 9 July 2026. It covers the period from 1 January 1995 to 30 April 2026 and contains property transactions which have been registered during that period. Contains HM Land Registry data © Crown copyright and database right 2026. This data is licensed under the Open Government Licence v3.0.
Disclaimer: Rightmove.co.uk provides this HM Land Registry data "as is". The burden for fitness of the data relies completely with the user and is provided for informational purposes only. No warranty, express or implied, is given relating to the accuracy of content of the HM Land Registry data and Rightmove does not accept any liability for error or omission. If you have found an error with the data or need further information please contact HM Land Registry.
Permitted Use: Viewers of this Information are granted permission to access this Crown copyright material and to download it onto electronic, magnetic, optical or similar storage media provided that such activities are for private research, study or in-house use only. Any other use of the material requires the formal written permission of Land Registry which can be requested from us, and is subject to an additional licence and associated charge.
Rightmove takes no liability for your use of, or reliance on, Rightmove's Instant Valuation due to the limitations of our tracking tool listed here. Use of this tool is taken entirely at your own risk. All rights reserved.