
House Prices in Cranbrook
House prices in Cranbrook have an overall average of £277,449 over the last year.
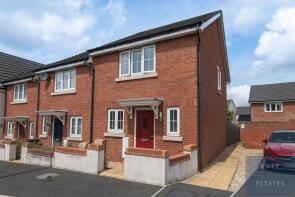
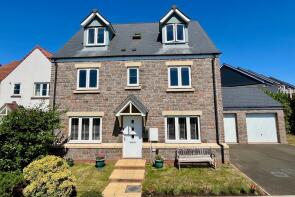
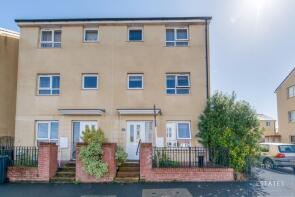
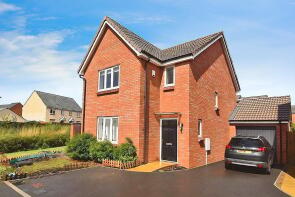
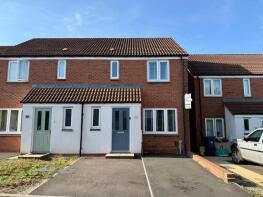
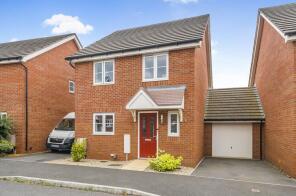
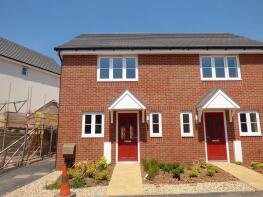
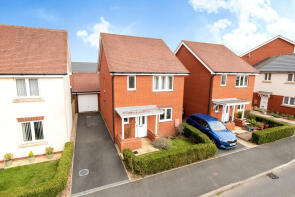
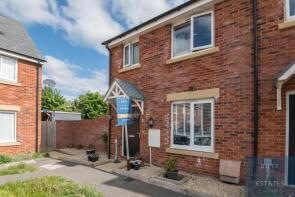
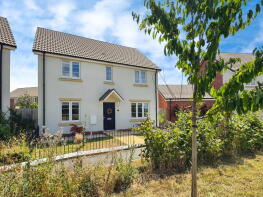
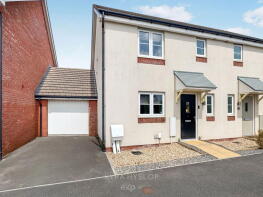
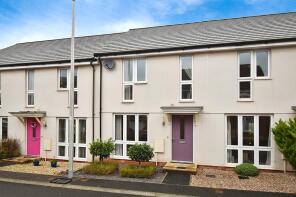
The majority of properties sold in Cranbrook during the last year were terraced properties, selling for an average price of £246,750. Semi-detached properties sold for an average of £275,521, with detached properties fetching £380,545.
Overall, the historical sold prices in Cranbrook over the last year were 3% down on the previous year and 50% down on the 2002 peak of £550,000.
Properties Sold
12, Copseclose Lane, Exeter EX5 7AP

| Today | See what it's worth now |
| 20 Feb 2026 | £227,000 |
| 2 Jun 2015 | £188,100 |
No other historical records.
23, Henrys Run, Exeter EX5 7AU

| Today | See what it's worth now |
| 16 Feb 2026 | £277,000 |
| 1 Nov 2013 | £219,995 |
No other historical records.
42, Alford Pasture, Exeter EX5 7EB
| Today | See what it's worth now |
| 13 Feb 2026 | £232,500 |
| 22 Dec 2017 | £219,500 |
No other historical records.
28, Great Meadow, Exeter EX5 7EP
| Today | See what it's worth now |
| 11 Feb 2026 | £440,000 |
| 27 May 2016 | £379,995 |
No other historical records.
5, Younghayes Road, Exeter EX5 7DR
| Today | See what it's worth now |
| 6 Feb 2026 | £300,000 |
| 21 Dec 2018 | £270,000 |
No other historical records.
53, Younghayes Road, Exeter EX5 7DR
| Today | See what it's worth now |
| 4 Feb 2026 | £145,000 |
| 15 Sep 2021 | £132,500 |
5, Chaffinch Rise, Exeter EX5 7GW


| Today | See what it's worth now |
| 2 Feb 2026 | £475,000 |
| 30 Sep 2021 | £409,950 |
No other historical records.
90, Tillhouse Road, Exeter EX5 7FE
| Today | See what it's worth now |
| 23 Jan 2026 | £333,000 |
| 29 Sep 2017 | £258,000 |
No other historical records.
12, Water Lake Avenue, Exeter EX5 7HW
| Today | See what it's worth now |
| 19 Jan 2026 | £352,000 |
| 28 Jun 2021 | £290,000 |
No other historical records.
15, Inner Westland, Exeter EX5 7EQ
| Today | See what it's worth now |
| 12 Jan 2026 | £260,000 |
| 26 Feb 2015 | £194,995 |
No other historical records.
14, Buzzard Way, Exeter EX5 7GX

| Today | See what it's worth now |
| 9 Jan 2026 | £260,000 |
| 13 Dec 2019 | £234,995 |
No other historical records.
47, Shareford Way, Exeter EX5 7EZ
| Today | See what it's worth now |
| 19 Dec 2025 | £327,500 |
| 30 May 2017 | £283,995 |
No other historical records.
54, Shareford Way, Exeter EX5 7EZ
| Today | See what it's worth now |
| 19 Dec 2025 | £230,000 |
| 29 Jun 2017 | £200,000 |
No other historical records.
14, Mayfield Way, Exeter EX5 7BE
| Today | See what it's worth now |
| 19 Dec 2025 | £305,000 |
| 21 Dec 2012 | £239,995 |
No other historical records.
225, Tillhouse Road, Exeter EX5 7FL
| Today | See what it's worth now |
| 19 Dec 2025 | £310,000 |
| 29 Sep 2017 | £252,000 |
No other historical records.
34, Horsewell Road, Cranbrook EX5 7JB
| Today | See what it's worth now |
| 19 Dec 2025 | £272,000 |
| 24 Mar 2021 | £237,500 |
No other historical records.
22, Radfords Turf, Exeter EX5 7DX

| Today | See what it's worth now |
| 19 Dec 2025 | £280,299 |
| 27 Sep 2021 | £260,000 |
No other historical records.
29, Buzzard Way, Exeter EX5 7GQ

| Today | See what it's worth now |
| 17 Dec 2025 | £250,000 |
| 28 Nov 2019 | £207,000 |
No other historical records.
11, Sweet Coppin, Exeter EX5 7FB
| Today | See what it's worth now |
| 16 Dec 2025 | £268,000 |
| 31 Mar 2016 | £234,000 |
No other historical records.
1, Little Sanson, Exeter EX5 7JR
| Today | See what it's worth now |
| 15 Dec 2025 | £229,000 |
| 2 Jun 2023 | £255,000 |
No other historical records.
31, Chaffinch Rise, Cranbrook EX5 7GW
| Today | See what it's worth now |
| 12 Dec 2025 | £240,000 |
| 25 Jun 2020 | £204,950 |
No other historical records.
32, Tillhouse Road, Exeter EX5 7FE
| Today | See what it's worth now |
| 10 Dec 2025 | £327,500 |
| 24 Jun 2016 | £250,000 |
No other historical records.
46, Orchard Way, Exeter EX5 7HY
| Today | See what it's worth now |
| 5 Dec 2025 | £400,000 |
| 29 Apr 2022 | £365,000 |
No other historical records.
9, Crab Apple, Exeter EX5 7EH
| Today | See what it's worth now |
| 5 Dec 2025 | £295,000 |
| 31 May 2017 | £248,500 |
No other historical records.
10, Gratton Park, Exeter EX5 7AS
| Today | See what it's worth now |
| 5 Dec 2025 | £235,000 |
| 8 Aug 2019 | £175,000 |
No other historical records.
Source Acknowledgement: © Crown copyright. England and Wales house price data is publicly available information produced by the HM Land Registry.This material was last updated on 9 April 2026. It covers the period from 1 January 1995 to 27 February 2026 and contains property transactions which have been registered during that period. Contains HM Land Registry data © Crown copyright and database right 2026. This data is licensed under the Open Government Licence v3.0.
Disclaimer: Rightmove.co.uk provides this HM Land Registry data "as is". The burden for fitness of the data relies completely with the user and is provided for informational purposes only. No warranty, express or implied, is given relating to the accuracy of content of the HM Land Registry data and Rightmove does not accept any liability for error or omission. If you have found an error with the data or need further information please contact HM Land Registry.
Permitted Use: Viewers of this Information are granted permission to access this Crown copyright material and to download it onto electronic, magnetic, optical or similar storage media provided that such activities are for private research, study or in-house use only. Any other use of the material requires the formal written permission of Land Registry which can be requested from us, and is subject to an additional licence and associated charge.
Map data ©OpenStreetMap contributors.
Rightmove takes no liability for your use of, or reliance on, Rightmove's Instant Valuation due to the limitations of our tracking tool listed here. Use of this tool is taken entirely at your own risk. All rights reserved.