
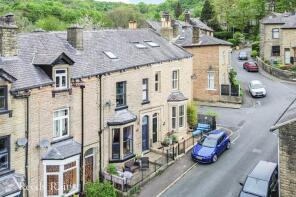
House Prices in Cross Stone
House prices in Cross Stone have an overall average of £177,373 over the last year.
The majority of properties sold in Cross Stone during the last year were terraced properties, selling for an average price of £163,467. Semi-detached properties sold for an average of £205,800, with detached properties fetching £430,000.
Overall, the historical sold prices in Cross Stone over the last year were 10% up on the previous year and 8% up on the 2023 peak of £163,498.
Properties Sold
13, Hammerton Terrace, Dalton Street, Todmorden OL14 5HR
| Today | See what it's worth now |
| 20 Mar 2026 | £145,000 |
| 23 Jun 2014 | £105,000 |
No other historical records.
3, Garden Street, Todmorden OL14 5HW
| Today | See what it's worth now |
| 13 Mar 2026 | £75,000 |
| 19 Oct 2001 | £19,000 |
No other historical records.
88, Cambridge Street, Todmorden OL14 5BJ
| Today | See what it's worth now |
| 6 Mar 2026 | £170,000 |
| 27 Jul 2021 | £110,700 |
50, Garden Street, Todmorden OL14 5HW
| Today | See what it's worth now |
| 27 Feb 2026 | £160,000 |
| 26 Sep 2005 | £91,000 |
148, Burnley Road, Todmorden OL14 5LB
| Today | See what it's worth now |
| 6 Feb 2026 | £187,000 |
| 23 Jul 2018 | £127,000 |
20, Industrial Street, Todmorden OL14 5BP
| Today | See what it's worth now |
| 6 Feb 2026 | £165,000 |
| 23 Jul 2015 | £58,000 |
No other historical records.
8, Victoria Road, Todmorden OL14 5LP

| Today | See what it's worth now |
| 4 Feb 2026 | £60,000 |
| 10 Sep 1999 | £34,695 |
No other historical records.
61, Oak Avenue, Todmorden OL14 5NT
| Today | See what it's worth now |
| 23 Jan 2026 | £192,000 |
| 21 Oct 2019 | £120,000 |
47, Wellington Road, Todmorden OL14 5EQ
| Today | See what it's worth now |
| 15 Jan 2026 | £315,000 |
| 28 Aug 2020 | £150,000 |
Lindores, Burnley Road, Todmorden OL14 5EX
| Today | See what it's worth now |
| 15 Jan 2026 | £475,000 |
| 26 Jun 2020 | £330,000 |
41, Cambridge Street, Todmorden OL14 5BJ
| Today | See what it's worth now |
| 18 Dec 2025 | £117,500 |
| 30 Jun 2005 | £72,500 |
No other historical records.
14, Dale Street, Todmorden OL14 5PX
| Today | See what it's worth now |
| 12 Dec 2025 | £205,000 |
No other historical records.
23, Industrial Street, Todmorden OL14 5BP
| Today | See what it's worth now |
| 12 Dec 2025 | £157,000 |
| 12 Aug 2005 | £65,000 |
No other historical records.
26, Cowhurst Avenue, Todmorden OL14 5PG
| Today | See what it's worth now |
| 10 Dec 2025 | £195,000 |
| 6 Apr 2001 | £26,100 |
No other historical records.
54, Wellington Road, Todmorden OL14 5HN
| Today | See what it's worth now |
| 9 Dec 2025 | £187,500 |
| 29 Aug 2014 | £55,000 |
No other historical records.
17, Wood Street, Todmorden OL14 5JD
| Today | See what it's worth now |
| 8 Dec 2025 | £162,000 |
| 10 Aug 2022 | £120,000 |
31, Stansfield Street, Todmorden OL14 5ED

| Today | See what it's worth now |
| 8 Dec 2025 | £175,500 |
| 13 Mar 2018 | £120,000 |
34, Wellington Road, Todmorden OL14 5HL
| Today | See what it's worth now |
| 5 Dec 2025 | £119,995 |
| 18 Jan 2005 | £79,500 |
9, Buckley View, Todmorden OL14 5JR

| Today | See what it's worth now |
| 5 Dec 2025 | £361,000 |
No other historical records.
18, Sackville Street, Todmorden OL14 5BS

| Today | See what it's worth now |
| 5 Dec 2025 | £80,000 |
| 7 Jul 2021 | £75,000 |
17, Royd Street, Todmorden OL14 5JL
| Today | See what it's worth now |
| 1 Dec 2025 | £200,000 |
| 25 Oct 2018 | £129,950 |
61, Cambridge Street, Todmorden OL14 5BJ
| Today | See what it's worth now |
| 28 Nov 2025 | £108,000 |
| 10 Dec 2020 | £80,000 |
No other historical records.
12, Broad Street, Todmorden OL14 5JQ
| Today | See what it's worth now |
| 28 Nov 2025 | £150,000 |
No other historical records.
Source Acknowledgement: © Crown copyright. England and Wales house price data is publicly available information produced by the HM Land Registry.This material was last updated on 15 May 2026. It covers the period from 1 January 1995 to 31 March 2026 and contains property transactions which have been registered during that period. Contains HM Land Registry data © Crown copyright and database right 2026. This data is licensed under the Open Government Licence v3.0.
Disclaimer: Rightmove.co.uk provides this HM Land Registry data "as is". The burden for fitness of the data relies completely with the user and is provided for informational purposes only. No warranty, express or implied, is given relating to the accuracy of content of the HM Land Registry data and Rightmove does not accept any liability for error or omission. If you have found an error with the data or need further information please contact HM Land Registry.
Permitted Use: Viewers of this Information are granted permission to access this Crown copyright material and to download it onto electronic, magnetic, optical or similar storage media provided that such activities are for private research, study or in-house use only. Any other use of the material requires the formal written permission of Land Registry which can be requested from us, and is subject to an additional licence and associated charge.
Rightmove takes no liability for your use of, or reliance on, Rightmove's Instant Valuation due to the limitations of our tracking tool listed here. Use of this tool is taken entirely at your own risk. All rights reserved.