
House Prices in Cwm
House prices in Cwm have an overall average of £111,438 over the last year.
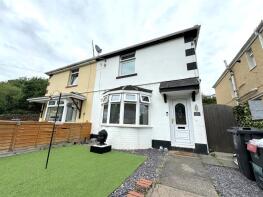
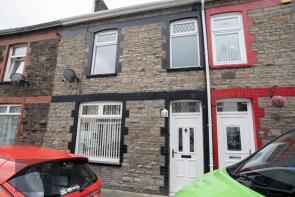
The majority of properties sold in Cwm during the last year were terraced properties, selling for an average price of £108,533. Semi-detached properties sold for an average of £155,000.
Overall, the historical sold prices in Cwm over the last year were similar to the previous year and 6% up on the 2022 peak of £105,053.
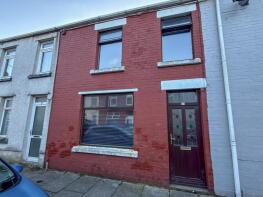
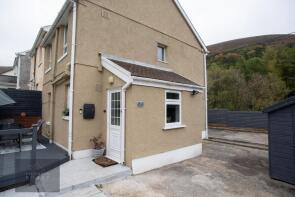
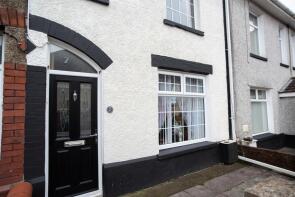
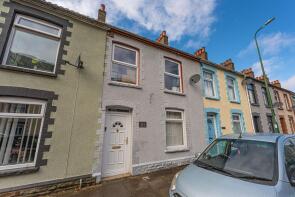
Properties Sold
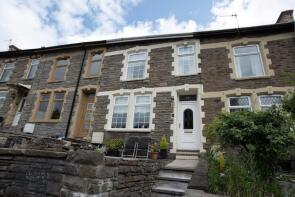
16, Curre Street, Cwm, Ebbw Vale NP23 7RB
| Today | See what it's worth now |
| 10 Apr 2026 | £82,500 |
| 6 Oct 2020 | £61,500 |
No other historical records.
25, Cendl Terrace, Cwm, Ebbw Vale NP23 7RX
| Today | See what it's worth now |
| 27 Mar 2026 | £155,000 |
| 26 Jun 2015 | £72,000 |
No other historical records.
7, Itton Street, Cwm, Ebbw Vale NP23 7RP
| Today | See what it's worth now |
| 24 Mar 2026 | £123,000 |
| 28 Jun 2022 | £125,000 |
No other historical records.
222, Marine Street, Cwm, Ebbw Vale NP23 7TA
| Today | See what it's worth now |
| 3 Feb 2026 | £121,500 |
| 3 Nov 2021 | £112,000 |
97, Marine Street, Cwm, Ebbw Vale NP23 7SU

| Today | See what it's worth now |
| 30 Jan 2026 | £43,000 |
| 3 Jan 2007 | £71,500 |
54, Canning Street, Cwm, Ebbw Vale NP23 7RW
| Today | See what it's worth now |
| 22 Dec 2025 | £100,000 |
| 29 Sep 2000 | £34,950 |
No other historical records.
148, Marine Street, Cwm, Ebbw Vale NP23 7SZ
| Today | See what it's worth now |
| 17 Dec 2025 | £129,000 |
| 12 Oct 2007 | £68,000 |
No other historical records.
2, Carne Street, Cwm, Ebbw Vale NP23 7RJ
| Today | See what it's worth now |
| 28 Nov 2025 | £99,000 |
No other historical records.
230, Marine Street, Cwm, Ebbw Vale NP23 7TA
| Today | See what it's worth now |
| 21 Nov 2025 | £120,000 |
| 1 Apr 2021 | £86,500 |
225, Marine Street, Cwm, Ebbw Vale NP23 7TA
| Today | See what it's worth now |
| 6 Nov 2025 | £120,000 |
No other historical records.
223, Marine Street, Cwm, Ebbw Vale NP23 7TA
| Today | See what it's worth now |
| 16 Oct 2025 | £120,000 |
No other historical records.
99, Curre Street, Cwm, Ebbw Vale NP23 7RE
| Today | See what it's worth now |
| 19 Sep 2025 | £87,000 |
No other historical records.
7, Stewart Street, Cwm, Ebbw Vale NP23 7TE
| Today | See what it's worth now |
| 29 Aug 2025 | £118,000 |
| 30 Oct 2009 | £79,950 |
39, Canning Street, Cwm, Ebbw Vale NP23 7RN
| Today | See what it's worth now |
| 11 Aug 2025 | £127,000 |
No other historical records.
1, Stanfield Street, Cwm, Ebbw Vale NP23 7TQ
| Today | See what it's worth now |
| 30 Jul 2025 | £108,000 |
| 30 May 2022 | £87,500 |
21, Marine Street, Cwm, Ebbw Vale NP23 7SS
| Today | See what it's worth now |
| 7 Jul 2025 | £130,000 |
| 7 Jul 2023 | £75,000 |
190, Marine Street, Cwm, Ebbw Vale NP23 7SZ
| Today | See what it's worth now |
| 23 May 2025 | £120,000 |
No other historical records.
194, Marine Street, Cwm, Ebbw Vale NP23 7SZ
| Today | See what it's worth now |
| 23 May 2025 | £90,000 |
No other historical records.
11, Station Terrace, Cwm, Ebbw Vale NP23 7SD
| Today | See what it's worth now |
| 29 Apr 2025 | £139,995 |
| 24 Apr 2003 | £17,250 |
No other historical records.
9, Cwm Terrace, Cwm, Ebbw Vale NP23 7RR
| Today | See what it's worth now |
| 17 Apr 2025 | £91,550 |
No other historical records.
18, Bailey Street, Cwm, Ebbw Vale NP23 7RT
| Today | See what it's worth now |
| 30 Jan 2025 | £147,500 |
| 9 Jan 1998 | £22,000 |
No other historical records.
129, Curre Street, Cwm, Ebbw Vale NP23 7RE
| Today | See what it's worth now |
| 27 Jan 2025 | £135,000 |
| 20 Dec 2017 | £90,000 |
No other historical records.
62, Canning Street, Cwm, Ebbw Vale NP23 7RW
| Today | See what it's worth now |
| 27 Jan 2025 | £120,000 |
No other historical records.
Source Acknowledgement: © Crown copyright. England and Wales house price data is publicly available information produced by the HM Land Registry.This material was last updated on 15 May 2026. It covers the period from 1 January 1995 to 31 March 2026 and contains property transactions which have been registered during that period. Contains HM Land Registry data © Crown copyright and database right 2026. This data is licensed under the Open Government Licence v3.0.
Disclaimer: Rightmove.co.uk provides this HM Land Registry data "as is". The burden for fitness of the data relies completely with the user and is provided for informational purposes only. No warranty, express or implied, is given relating to the accuracy of content of the HM Land Registry data and Rightmove does not accept any liability for error or omission. If you have found an error with the data or need further information please contact HM Land Registry.
Permitted Use: Viewers of this Information are granted permission to access this Crown copyright material and to download it onto electronic, magnetic, optical or similar storage media provided that such activities are for private research, study or in-house use only. Any other use of the material requires the formal written permission of Land Registry which can be requested from us, and is subject to an additional licence and associated charge.
Rightmove takes no liability for your use of, or reliance on, Rightmove's Instant Valuation due to the limitations of our tracking tool listed here. Use of this tool is taken entirely at your own risk. All rights reserved.