
House Prices in Dedham
House prices in Dedham have an overall average of £621,564 over the last year.
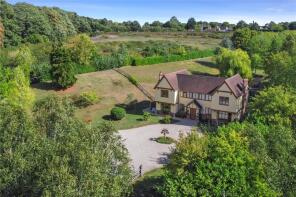
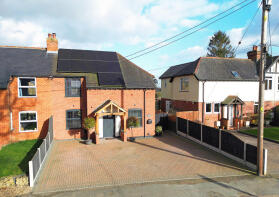
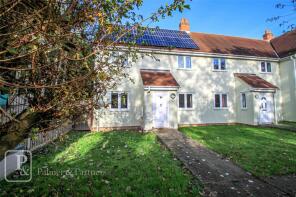
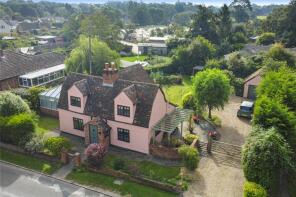
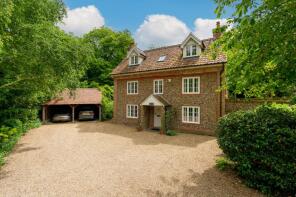
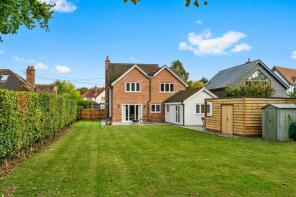
The majority of properties sold in Dedham during the last year were detached properties, selling for an average price of £730,862. Semi-detached properties sold for an average of £473,000, with terraced properties fetching £490,000.
Overall, the historical sold prices in Dedham over the last year were 9% down on the previous year and 9% down on the 2022 peak of £685,879.
Properties Sold
Meadows, Boxhouse Lane, Colchester CO7 6HZ
| Today | See what it's worth now |
| 27 Mar 2026 | £900,000 |
| 6 May 2005 | £515,000 |
No other historical records.
15 Foxglove House, Saunders Field, Colchester CO7 6FE
| Today | See what it's worth now |
| 25 Mar 2026 | £775,000 |
| 27 Sep 2017 | £570,000 |
No other historical records.
Little Oaks, Long Road West, Colchester CO7 6ER
| Today | See what it's worth now |
| 25 Mar 2026 | £1,200,000 |
| 29 Mar 2021 | £740,000 |
No other historical records.
14, Crownfields, Crown Street, Colchester CO7 6AT
| Today | See what it's worth now |
| 16 Jan 2026 | £470,000 |
| 31 Jul 1997 | £69,995 |
No other historical records.
15, Dedham Meade, Colchester CO7 6EU
| Today | See what it's worth now |
| 6 Jan 2026 | £470,000 |
| 7 Dec 2022 | £565,000 |
Meadowview, Birchwood Cottages, Birchwood Road, Dedham CO7 6HX
| Today | See what it's worth now |
| 14 Nov 2025 | £380,000 |
| 23 Jul 2010 | £190,000 |
No other historical records.
Blackmore House, The Heath, Colchester CO7 6BU
| Today | See what it's worth now |
| 30 Oct 2025 | £846,892 |
| 29 Oct 2009 | £710,000 |
No other historical records.
Hampton, Monks Lane, Dedham CO7 6DZ
| Today | See what it's worth now |
| 27 Oct 2025 | £500,000 |
No other historical records.
35, Dedham Mill, Mill Lane, Colchester CO7 6DJ
| Today | See what it's worth now |
| 11 Sep 2025 | £490,000 |
| 17 Feb 2017 | £445,000 |
3, Crownfields, Crown Street, Colchester CO7 6AT
| Today | See what it's worth now |
| 2 Sep 2025 | £450,000 |
| 14 Feb 2020 | £275,000 |
No other historical records.
Honeysuckle Cottage, Ardleigh Road, Colchester CO7 6EQ
| Today | See what it's worth now |
| 2 Sep 2025 | £565,000 |
| 6 Feb 2007 | £420,000 |
Heath Cottage, The Heath, Colchester CO7 6BU
| Today | See what it's worth now |
| 27 Aug 2025 | £630,000 |
| 22 Jun 2011 | £380,000 |
Clemwood, Ardleigh Road, Dedham CO7 6EQ
| Today | See what it's worth now |
| 8 Aug 2025 | £590,000 |
No other historical records.
12, Crownfields, Crown Street, Colchester CO7 6AT
| Today | See what it's worth now |
| 21 Jul 2025 | £435,000 |
| 20 Nov 2018 | £375,000 |
No other historical records.
3, Church View, Long Road West, Colchester CO7 6EX
| Today | See what it's worth now |
| 27 Jun 2025 | £225,000 |
| 23 Jun 2017 | £195,000 |
7, Dedham Mill, Mill Lane, Colchester CO7 6DJ
| Today | See what it's worth now |
| 16 Jun 2025 | £244,000 |
| 26 Sep 2008 | £196,000 |
The Cottage, Long Road East, Colchester CO7 6BS
| Today | See what it's worth now |
| 21 Mar 2025 | £1,275,000 |
| 6 Sep 2002 | £535,000 |
No other historical records.
Chapel Cottage, Long Road East, Dedham CO7 6BW
| Today | See what it's worth now |
| 14 Mar 2025 | £590,000 |
No other historical records.
Stone Cottage, Gun Hill, Colchester CO7 6HP
| Today | See what it's worth now |
| 12 Mar 2025 | £1,200,000 |
| 7 Sep 2011 | £620,000 |
9, Dedham Mill, Mill Lane, Colchester CO7 6DJ
| Today | See what it's worth now |
| 5 Mar 2025 | £259,500 |
| 31 Mar 2016 | £222,000 |
Creg Ny Baa, The Heath, Colchester CO7 6BT
| Today | See what it's worth now |
| 28 Feb 2025 | £805,000 |
| 29 Jun 2017 | £375,000 |
No other historical records.
2, Barkers Terrace, East Lane, Colchester CO7 6BE
| Today | See what it's worth now |
| 14 Feb 2025 | £225,000 |
| 24 Feb 2016 | £160,000 |
No other historical records.
3, Barkers Terrace, East Lane, Colchester CO7 6BE

| Today | See what it's worth now |
| 14 Feb 2025 | £225,000 |
| 14 Feb 2011 | £114,000 |
No other historical records.

Source Acknowledgement: © Crown copyright. England and Wales house price data is publicly available information produced by the HM Land Registry.This material was last updated on 9 July 2026. It covers the period from 1 January 1995 to 30 April 2026 and contains property transactions which have been registered during that period. Contains HM Land Registry data © Crown copyright and database right 2026. This data is licensed under the Open Government Licence v3.0.
Disclaimer: Rightmove.co.uk provides this HM Land Registry data "as is". The burden for fitness of the data relies completely with the user and is provided for informational purposes only. No warranty, express or implied, is given relating to the accuracy of content of the HM Land Registry data and Rightmove does not accept any liability for error or omission. If you have found an error with the data or need further information please contact HM Land Registry.
Permitted Use: Viewers of this Information are granted permission to access this Crown copyright material and to download it onto electronic, magnetic, optical or similar storage media provided that such activities are for private research, study or in-house use only. Any other use of the material requires the formal written permission of Land Registry which can be requested from us, and is subject to an additional licence and associated charge.
Rightmove takes no liability for your use of, or reliance on, Rightmove's Instant Valuation due to the limitations of our tracking tool listed here. Use of this tool is taken entirely at your own risk. All rights reserved.