
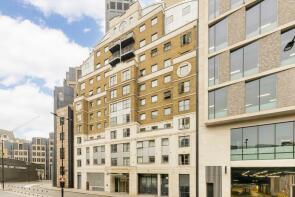
House Prices in EC1A
House prices in EC1A have an overall average of £886,818 over the last year.
Overall, the historical sold prices in EC1A over the last year were similar to the previous year and 39% down on the 2020 peak of £1,444,114.
Properties Sold
Flat 44, 75, Little Britain, London EC1A 7BT

| Today | See what it's worth now |
| 27 Feb 2026 | £835,000 |
| 30 Mar 2016 | £900,000 |
Flat 402, 10, Hosier Lane, London EC1A 9LS

| Today | See what it's worth now |
| 8 Jan 2026 | £450,000 |
| 25 Jun 2003 | £250,000 |
No other historical records.
Flat 703, 10, Hosier Lane, London EC1A 9LS
| Today | See what it's worth now |
| 15 Dec 2025 | £500,000 |
| 20 Dec 2005 | £286,000 |
Extensions and planning permission in EC1A
See planning approval stats, extension build costs and value added estimates.

Apartment 1.2, 61 Hogarth House, Bartholomew Close, London EC1A 7BF
| Today | See what it's worth now |
| 20 Nov 2025 | £1,230,000 |
| 1 Nov 2018 | £880,000 |
No other historical records.
Flat 12, 64, West Smithfield, London EC1A 9DY
| Today | See what it's worth now |
| 7 Nov 2025 | £482,500 |
| 28 Apr 2000 | £160,000 |
No other historical records.
Flat 6, 1 3, Newbury Street, London EC1A 7HU
| Today | See what it's worth now |
| 31 Oct 2025 | £975,000 |
| 22 Dec 2006 | £528,000 |
No other historical records.
50, 110 115 Cathedral Lodge, Aldersgate Street, London EC1A 4JE

| Today | See what it's worth now |
| 24 Oct 2025 | £2,075,000 |
| 19 Apr 1996 | £220,000 |
No other historical records.
31, 110 115 Cathedral Lodge, Aldersgate Street, London EC1A 4JE

| Today | See what it's worth now |
| 22 Sep 2025 | £540,000 |
| 7 Nov 2014 | £585,000 |
Flat 10, 5 Wesley House, Little Britain, London EC1A 7BX

| Today | See what it's worth now |
| 9 Sep 2025 | £630,000 |
| 8 Jul 1996 | £154,500 |
No other historical records.
Flat 12, 43, Bartholomew Close, London EC1A 7HN
| Today | See what it's worth now |
| 15 Aug 2025 | £437,500 |
| 26 Jul 2004 | £242,000 |
Apartment 4.4, 50 The Levett Building, Little Britain, London EC1A 7BR

| Today | See what it's worth now |
| 14 Aug 2025 | £1,600,000 |
| 12 Feb 2020 | £1,795,500 |
No other historical records.
Flat 27, 28, Bartholomew Close, London EC1A 7ES

| Today | See what it's worth now |
| 28 Jul 2025 | £538,000 |
| 2 Sep 2013 | £475,000 |
Flat 27, 75, Little Britain, London EC1A 7BT
| Today | See what it's worth now |
| 11 Jul 2025 | £515,000 |
| 3 Mar 2014 | £236,250 |
Flat 68, 172 London House, Aldersgate Street, London EC1A 4HU
| Today | See what it's worth now |
| 6 Jun 2025 | £455,000 |
| 26 Mar 2003 | £250,000 |
37, 110 115 Cathedral Lodge, Aldersgate Street, London EC1A 4JE

| Today | See what it's worth now |
| 31 Mar 2025 | £570,000 |
| 29 Mar 1996 | £131,995 |
No other historical records.
29, 110 115 Cathedral Lodge, Aldersgate Street, London EC1A 4JE

| Today | See what it's worth now |
| 31 Mar 2025 | £625,000 |
| 9 Oct 2013 | £600,000 |
Apartment 0.3, 50 The Askew Building, Bartholomew Close, London EC1A 7BD

| Today | See what it's worth now |
| 18 Mar 2025 | £2,300,000 |
| 23 Apr 2024 | £2,300,000 |
Flat 8, 58 St Bartholomew House, West Smithfield, London EC1A 9DS
| Today | See what it's worth now |
| 13 Mar 2025 | £865,000 |
| 2 Dec 2016 | £805,000 |
No other historical records.
Flat 29, 172 London House, Aldersgate Street, London EC1A 4HU
| Today | See what it's worth now |
| 3 Mar 2025 | £710,000 |
| 31 Jan 2001 | £279,950 |
No other historical records.
Flat 11, 28, Bartholomew Close, London EC1A 7ES
| Today | See what it's worth now |
| 14 Feb 2025 | £862,500 |
| 9 Jan 1998 | £234,950 |
No other historical records.
Flat 18, 75, Little Britain, London EC1A 7BT
| Today | See what it's worth now |
| 10 Jan 2025 | £557,500 |
| 30 Sep 2002 | £277,500 |
35, 110 115 Cathedral Lodge, Aldersgate Street, London EC1A 4JE

| Today | See what it's worth now |
| 7 Jan 2025 | £580,000 |
| 22 Dec 1995 | £172,000 |
No other historical records.
Flat 314, 10, Hosier Lane, London EC1A 9LS
| Today | See what it's worth now |
| 20 Nov 2024 | £420,000 |
| 22 Aug 2006 | £286,000 |


Source Acknowledgement: © Crown copyright. England and Wales house price data is publicly available information produced by the HM Land Registry.This material was last updated on 9 July 2026. It covers the period from 1 January 1995 to 30 April 2026 and contains property transactions which have been registered during that period. Contains HM Land Registry data © Crown copyright and database right 2026. This data is licensed under the Open Government Licence v3.0.
Disclaimer: Rightmove.co.uk provides this HM Land Registry data "as is". The burden for fitness of the data relies completely with the user and is provided for informational purposes only. No warranty, express or implied, is given relating to the accuracy of content of the HM Land Registry data and Rightmove does not accept any liability for error or omission. If you have found an error with the data or need further information please contact HM Land Registry.
Permitted Use: Viewers of this Information are granted permission to access this Crown copyright material and to download it onto electronic, magnetic, optical or similar storage media provided that such activities are for private research, study or in-house use only. Any other use of the material requires the formal written permission of Land Registry which can be requested from us, and is subject to an additional licence and associated charge.
Rightmove takes no liability for your use of, or reliance on, Rightmove's Instant Valuation due to the limitations of our tracking tool listed here. Use of this tool is taken entirely at your own risk. All rights reserved.