
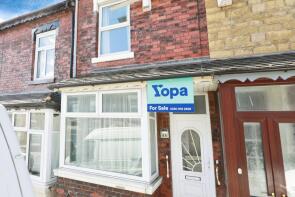
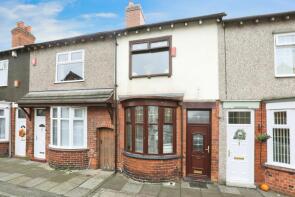
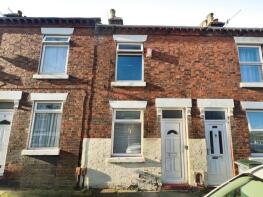
House Prices in Fenton Low
House prices in Fenton Low have an overall average of £126,019 over the last year.
The majority of properties sold in Fenton Low during the last year were terraced properties, selling for an average price of £108,143. Semi-detached properties sold for an average of £154,375, with detached properties fetching £189,500.
Overall, the historical sold prices in Fenton Low over the last year were 16% up on the previous year and 10% up on the 2018 peak of £114,139.
Properties Sold
97, Regent Road, Hanley, Stoke-on-trent ST1 3BL
| Today | See what it's worth now |
| 19 Mar 2026 | £131,000 |
| 4 Apr 2022 | £45,000 |
No other historical records.
51, Commercial Road, Hanley, Stoke-on-trent ST1 3QR
| Today | See what it's worth now |
| 17 Mar 2026 | £180,000 |
| 28 Jul 2017 | £139,995 |
No other historical records.
17, Picton Street, Hanley, Stoke-on-trent ST1 3QA
| Today | See what it's worth now |
| 27 Feb 2026 | £185,000 |
| 29 Jun 2018 | £149,500 |
No other historical records.
32, Seymour Street, Hanley, Stoke-on-trent ST1 3NX
| Today | See what it's worth now |
| 27 Feb 2026 | £111,000 |
| 26 Aug 2022 | £140,000 |
No other historical records.
27 First Floor Apartment, Lock Keepers Way, Hanley, Stoke-on-trent ST1 3NS

| Today | See what it's worth now |
| 13 Feb 2026 | £83,500 |
| 16 Jun 2023 | £90,000 |
19, Commercial Road, Hanley, Stoke-on-trent ST1 3QR
| Today | See what it's worth now |
| 29 Jan 2026 | £140,000 |
| 30 Sep 2016 | £124,995 |
43, Balfour Street, Hanley, Stoke-on-trent ST1 3QN
| Today | See what it's worth now |
| 16 Jan 2026 | £90,000 |
| 13 Oct 2003 | £44,000 |
22, Cotesheath Street, Hanley, Stoke-on-trent ST1 3JD
| Today | See what it's worth now |
| 12 Jan 2026 | £120,000 |
| 2 Feb 2018 | £76,000 |
12, Hazelhurst Street, Hanley, Stoke-on-trent ST1 3HF

| Today | See what it's worth now |
| 6 Jan 2026 | £110,000 |
| 29 Mar 2018 | £78,500 |
25, Commercial Road, Hanley, Stoke-on-trent ST1 3QR
| Today | See what it's worth now |
| 12 Dec 2025 | £205,000 |
| 30 Sep 2016 | £152,995 |
17, Lock Keepers Way, Hanley, Stoke-on-trent ST1 3NS
| Today | See what it's worth now |
| 8 Dec 2025 | £65,000 |
| 30 Jun 2021 | £70,000 |
7, Wainwright Walk, Hanley, Stoke-on-trent ST1 3QY
| Today | See what it's worth now |
| 6 Nov 2025 | £96,000 |
No other historical records.
27, Wellington Road, Hanley, Stoke-on-trent ST1 3QH
| Today | See what it's worth now |
| 6 Oct 2025 | £192,000 |
| 29 Jan 2021 | £168,995 |
98, Well Street, Hanley, Stoke-on-trent ST1 3PT
| Today | See what it's worth now |
| 3 Oct 2025 | £88,000 |
No other historical records.
26, Franklyn Street, Hanley, Stoke-on-trent ST1 3HD
| Today | See what it's worth now |
| 30 Sep 2025 | £105,000 |
| 4 Sep 2002 | £23,500 |
32, Cotesheath Street, Hanley, Stoke-on-trent ST1 3JD

| Today | See what it's worth now |
| 26 Sep 2025 | £90,000 |
| 21 Jun 2007 | £75,000 |
47, Hazelhurst Street, Hanley, Stoke-on-trent ST1 3HG

| Today | See what it's worth now |
| 12 Sep 2025 | £102,000 |
| 12 Oct 2007 | £73,000 |
No other historical records.
48, Waterloo Street, Hanley, Stoke-on-trent ST1 3PR
| Today | See what it's worth now |
| 10 Sep 2025 | £175,000 |
| 30 Nov 2018 | £154,995 |
37, Hazelhurst Street, Hanley, Stoke-on-trent ST1 3HG
| Today | See what it's worth now |
| 22 Aug 2025 | £90,000 |
No other historical records.
3, Old Wharf Place, Hanley, Stoke-on-trent ST1 3NL
| Today | See what it's worth now |
| 13 Aug 2025 | £140,000 |
| 15 Oct 2021 | £110,000 |
No other historical records.
12, Rosedawn Close East, Hanley, Stoke-on-trent ST1 3TH

| Today | See what it's worth now |
| 25 Jul 2025 | £200,000 |
| 1 Oct 2010 | £142,500 |
44, Eagle Street, Hanley, Stoke-on-trent ST1 3PE
| Today | See what it's worth now |
| 23 Jul 2025 | £105,000 |
| 1 Dec 2000 | £33,250 |
No other historical records.
37, Wellington Road, Hanley, Stoke-on-trent ST1 3QH
| Today | See what it's worth now |
| 18 Jul 2025 | £187,000 |
| 9 Apr 2021 | £170,995 |
Source Acknowledgement: © Crown copyright. England and Wales house price data is publicly available information produced by the HM Land Registry.This material was last updated on 9 July 2026. It covers the period from 1 January 1995 to 30 April 2026 and contains property transactions which have been registered during that period. Contains HM Land Registry data © Crown copyright and database right 2026. This data is licensed under the Open Government Licence v3.0.
Disclaimer: Rightmove.co.uk provides this HM Land Registry data "as is". The burden for fitness of the data relies completely with the user and is provided for informational purposes only. No warranty, express or implied, is given relating to the accuracy of content of the HM Land Registry data and Rightmove does not accept any liability for error or omission. If you have found an error with the data or need further information please contact HM Land Registry.
Permitted Use: Viewers of this Information are granted permission to access this Crown copyright material and to download it onto electronic, magnetic, optical or similar storage media provided that such activities are for private research, study or in-house use only. Any other use of the material requires the formal written permission of Land Registry which can be requested from us, and is subject to an additional licence and associated charge.
Rightmove takes no liability for your use of, or reliance on, Rightmove's Instant Valuation due to the limitations of our tracking tool listed here. Use of this tool is taken entirely at your own risk. All rights reserved.