
House Prices in Fetcham
House prices in Fetcham have an overall average of £717,551 over the last year.
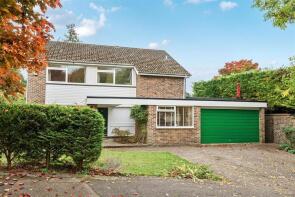
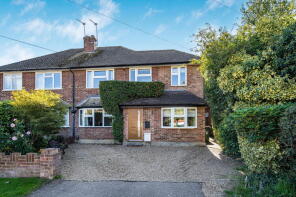
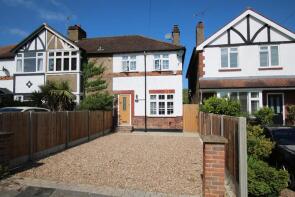
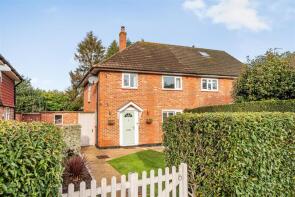
The majority of properties sold in Fetcham during the last year were detached properties, selling for an average price of £903,668. Semi-detached properties sold for an average of £613,409, with terraced properties fetching £417,917.
Overall, the historical sold prices in Fetcham over the last year were 9% down on the previous year and 9% down on the 2022 peak of £786,028.
Properties Sold
7, Camilla Close, Great Bookham KT23 4BU
| Today | See what it's worth now |
| 27 Mar 2026 | £806,000 |
No other historical records.
40, Howard Road, Leatherhead KT23 4PW
| Today | See what it's worth now |
| 24 Mar 2026 | £845,000 |
| 28 Jul 2016 | £760,000 |
3, Elmer Cottages, Leatherhead KT22 9DH
| Today | See what it's worth now |
| 20 Mar 2026 | £788,000 |
| 6 Dec 2016 | £530,000 |
No other historical records.
12, Bookham Grove, Leatherhead KT23 4NS
| Today | See what it's worth now |
| 19 Mar 2026 | £422,500 |
| 21 Nov 2019 | £380,000 |
10, Raymead Way, Leatherhead KT22 9LY
| Today | See what it's worth now |
| 13 Mar 2026 | £565,000 |
| 3 Sep 2015 | £480,000 |
9, Groveside Close, Leatherhead KT23 4LQ

| Today | See what it's worth now |
| 11 Mar 2026 | £1,072,500 |
| 29 Sep 2006 | £725,000 |
No other historical records.
11, Kennel Lane, Fetcham KT22 9PQ
| Today | See what it's worth now |
| 27 Feb 2026 | £650,000 |
No other historical records.
12, School Lane, Fetcham KT22 9JU
| Today | See what it's worth now |
| 27 Feb 2026 | £702,500 |
No other historical records.
2, The Oaks, Leatherhead KT22 9PP

| Today | See what it's worth now |
| 26 Feb 2026 | £899,950 |
| 19 Jun 2014 | £675,000 |
42, Oveton Way, Great Bookham KT23 4ND
| Today | See what it's worth now |
| 23 Feb 2026 | £450,000 |
No other historical records.
15a, Keswick Road, Fetcham KT22 9HQ

| Today | See what it's worth now |
| 19 Feb 2026 | £880,000 |
No other historical records.
60, The Street, Leatherhead KT22 9RF
| Today | See what it's worth now |
| 17 Feb 2026 | £650,000 |
| 22 Aug 2018 | £489,700 |
49, Badingham Drive, Leatherhead KT22 9HA
| Today | See what it's worth now |
| 17 Feb 2026 | £950,000 |
| 11 Nov 2009 | £560,000 |
No other historical records.
10, Mole Road, Leatherhead KT22 9RN
| Today | See what it's worth now |
| 6 Feb 2026 | £825,000 |
| 7 Dec 2015 | £530,000 |
No other historical records.
12, Warenne Road, Leatherhead KT22 9UQ
| Today | See what it's worth now |
| 6 Feb 2026 | £490,000 |
| 27 Jul 2016 | £390,000 |
13, Pound Crescent, Leatherhead KT22 9JW
| Today | See what it's worth now |
| 6 Feb 2026 | £595,000 |
| 28 Apr 2017 | £435,000 |
1, River Walk, Leatherhead KT22 9FF
| Today | See what it's worth now |
| 6 Feb 2026 | £780,000 |
| 29 Jun 2018 | £760,000 |
No other historical records.
48, Hawks Hill Court, Leatherhead KT22 9BX
| Today | See what it's worth now |
| 6 Feb 2026 | £253,000 |
| 11 Sep 1998 | £107,950 |
15, Harroway Manor, Cobham Road, Leatherhead KT22 9LL
| Today | See what it's worth now |
| 3 Feb 2026 | £407,500 |
| 29 May 2015 | £370,000 |
No other historical records.
53, Copperfields, Leatherhead KT22 9PA
| Today | See what it's worth now |
| 22 Jan 2026 | £535,000 |
| 21 Jan 2016 | £360,000 |
14, South End, Leatherhead KT23 4SQ
| Today | See what it's worth now |
| 22 Jan 2026 | £425,000 |
| 29 May 1996 | £81,000 |
No other historical records.
30, Shamrock Close, Fetcham KT22 9JG

| Today | See what it's worth now |
| 22 Jan 2026 | £370,000 |
| 31 Jan 2020 | £292,500 |
No other historical records.
21, The Spinney, Great Bookham KT23 3PZ
| Today | See what it's worth now |
| 15 Jan 2026 | £725,000 |
No other historical records.
Source Acknowledgement: © Crown copyright. England and Wales house price data is publicly available information produced by the HM Land Registry.This material was last updated on 9 July 2026. It covers the period from 1 January 1995 to 30 April 2026 and contains property transactions which have been registered during that period. Contains HM Land Registry data © Crown copyright and database right 2026. This data is licensed under the Open Government Licence v3.0.
Disclaimer: Rightmove.co.uk provides this HM Land Registry data "as is". The burden for fitness of the data relies completely with the user and is provided for informational purposes only. No warranty, express or implied, is given relating to the accuracy of content of the HM Land Registry data and Rightmove does not accept any liability for error or omission. If you have found an error with the data or need further information please contact HM Land Registry.
Permitted Use: Viewers of this Information are granted permission to access this Crown copyright material and to download it onto electronic, magnetic, optical or similar storage media provided that such activities are for private research, study or in-house use only. Any other use of the material requires the formal written permission of Land Registry which can be requested from us, and is subject to an additional licence and associated charge.
Rightmove takes no liability for your use of, or reliance on, Rightmove's Instant Valuation due to the limitations of our tracking tool listed here. Use of this tool is taken entirely at your own risk. All rights reserved.