
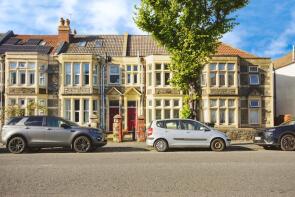
House Prices in Fishponds
House prices in Fishponds have an overall average of £346,165 over the last year.
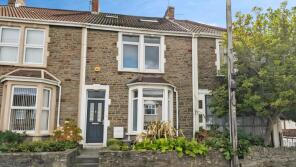
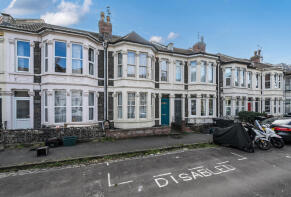
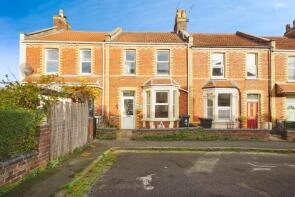
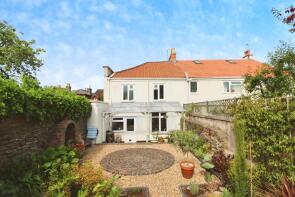
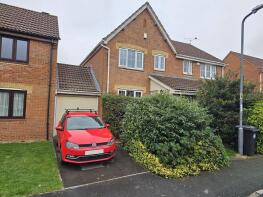
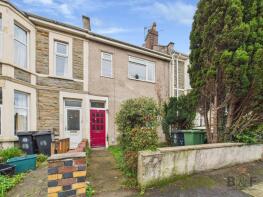
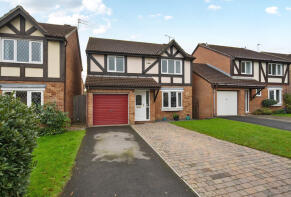
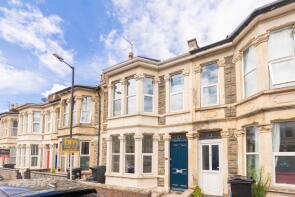
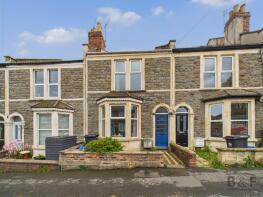
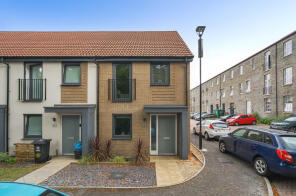
The majority of properties sold in Fishponds during the last year were terraced properties, selling for an average price of £374,908. Semi-detached properties sold for an average of £367,630, with flats fetching £178,569.
Overall, the historical sold prices in Fishponds over the last year were 10% up on the previous year and 6% up on the 2023 peak of £326,825.
Properties Sold
17, Thicket Road, Fishponds, Bristol BS16 4LW
| Today | See what it's worth now |
| 24 Apr 2026 | £427,500 |
| 11 May 2018 | £373,000 |
24, Coronation Avenue, Fishponds, Bristol BS16 3TS
| Today | See what it's worth now |
| 24 Apr 2026 | £360,000 |
| 13 Jul 2020 | £303,000 |
15, Maywood Avenue, Fishponds, Bristol BS16 4AN
| Today | See what it's worth now |
| 23 Apr 2026 | £320,000 |
| 17 Aug 2015 | £179,995 |
No other historical records.
15, Forest Road, Fishponds, Bristol BS16 3XH
| Today | See what it's worth now |
| 20 Apr 2026 | £360,000 |
| 7 May 2021 | £291,500 |
27, College Road, Fishponds, Bristol BS16 2HN

| Today | See what it's worth now |
| 16 Apr 2026 | £360,000 |
| 31 May 2019 | £302,000 |
No other historical records.
487, Fishponds Road, Fishponds, Bristol BS16 3AL
| Today | See what it's worth now |
| 7 Apr 2026 | £525,000 |
No other historical records.
16, Chester Park Road, Speedwell, Bristol BS16 3RG
| Today | See what it's worth now |
| 2 Apr 2026 | £320,000 |
| 7 Sep 2021 | £285,000 |
94, Vassall Road, Fishponds, Bristol BS16 2LW
| Today | See what it's worth now |
| 31 Mar 2026 | £332,000 |
| 27 Aug 2004 | £169,000 |
5, Grove Park Terrace, Fishponds, Bristol BS16 2BL

| Today | See what it's worth now |
| 31 Mar 2026 | £353,000 |
| 1 Sep 2017 | £253,000 |
17, Ridgeway Road, Fishponds, Bristol BS16 3DY
| Today | See what it's worth now |
| 27 Mar 2026 | £360,000 |
| 30 Mar 2006 | £159,500 |
No other historical records.
35, Field View Drive, Fishponds, Bristol BS16 2TT
| Today | See what it's worth now |
| 27 Mar 2026 | £483,000 |
| 6 Aug 2019 | £380,000 |
15, Coronation Avenue, Fishponds, Bristol BS16 3TS
| Today | See what it's worth now |
| 20 Mar 2026 | £388,000 |
| 21 Oct 2005 | £162,000 |
8, Kimberley Road, Fishponds, Bristol BS16 5AE
| Today | See what it's worth now |
| 20 Mar 2026 | £300,000 |
| 25 Jun 2004 | £115,000 |
No other historical records.
29, Chapel Road, Fishponds, Bristol BS16 2GN
| Today | See what it's worth now |
| 19 Mar 2026 | £134,000 |
No other historical records.
44, Gill Avenue, Fishponds, Bristol BS16 2NB
| Today | See what it's worth now |
| 17 Mar 2026 | £313,500 |
| 24 Aug 2018 | £270,000 |
3, Field View Drive, Fishponds, Bristol BS16 2TT
| Today | See what it's worth now |
| 17 Mar 2026 | £440,000 |
| 28 Apr 2023 | £495,000 |
125, Forest Road, Fishponds, Bristol BS16 3ST
| Today | See what it's worth now |
| 16 Mar 2026 | £450,000 |
| 18 Jan 2023 | £450,000 |
No other historical records.
24, Redhill Drive, Fishponds, Bristol BS16 2AQ
| Today | See what it's worth now |
| 13 Mar 2026 | £402,500 |
| 25 Feb 2002 | £89,000 |
No other historical records.
28, Oatley Way, Fishponds, Bristol BS16 2FU
| Today | See what it's worth now |
| 12 Mar 2026 | £332,000 |
| 22 Feb 2019 | £267,995 |
No other historical records.
3, Goffenton Drive, Fishponds, Bristol BS16 2QB
| Today | See what it's worth now |
| 6 Mar 2026 | £350,000 |
| 5 Jul 2017 | £280,000 |
16, Bishop Monk Avenue, Fishponds, Bristol BS16 2FP
| Today | See what it's worth now |
| 5 Mar 2026 | £467,500 |
| 17 Nov 2016 | £342,995 |
No other historical records.
93, Staple Hill Road, Fishponds, Bristol BS16 5AD
| Today | See what it's worth now |
| 3 Mar 2026 | £375,000 |
No other historical records.
38, Dominion Road, Fishponds, Bristol BS16 3EW
| Today | See what it's worth now |
| 27 Feb 2026 | £260,000 |
| 17 Apr 2003 | £126,000 |
No other historical records.
Source Acknowledgement: © Crown copyright. England and Wales house price data is publicly available information produced by the HM Land Registry.This material was last updated on 9 July 2026. It covers the period from 1 January 1995 to 30 April 2026 and contains property transactions which have been registered during that period. Contains HM Land Registry data © Crown copyright and database right 2026. This data is licensed under the Open Government Licence v3.0.
Disclaimer: Rightmove.co.uk provides this HM Land Registry data "as is". The burden for fitness of the data relies completely with the user and is provided for informational purposes only. No warranty, express or implied, is given relating to the accuracy of content of the HM Land Registry data and Rightmove does not accept any liability for error or omission. If you have found an error with the data or need further information please contact HM Land Registry.
Permitted Use: Viewers of this Information are granted permission to access this Crown copyright material and to download it onto electronic, magnetic, optical or similar storage media provided that such activities are for private research, study or in-house use only. Any other use of the material requires the formal written permission of Land Registry which can be requested from us, and is subject to an additional licence and associated charge.
Rightmove takes no liability for your use of, or reliance on, Rightmove's Instant Valuation due to the limitations of our tracking tool listed here. Use of this tool is taken entirely at your own risk. All rights reserved.