
House Prices in GU47
House prices in GU47 have an overall average of £473,950 over the last year.
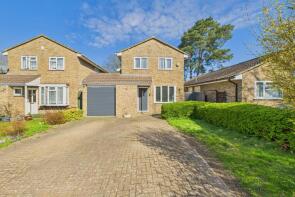
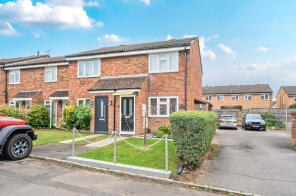
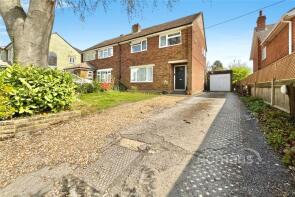
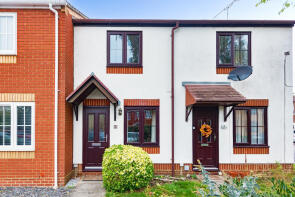
The majority of properties sold in GU47 during the last year were detached properties, selling for an average price of £610,809. Terraced properties sold for an average of £374,959, with semi-detached properties fetching £446,638.
Overall, the historical sold prices in GU47 over the last year were 3% up on the previous year and 8% up on the 2022 peak of £440,308.
Properties Sold
10, Cotswold Road, Sandhurst GU47 8NA
| Today | See what it's worth now |
| 24 Apr 2026 | £337,500 |
| 10 Sep 2009 | £205,000 |
71, Rookwood Avenue, Owlsmoor, Sandhurst GU47 0TY
| Today | See what it's worth now |
| 20 Apr 2026 | £400,000 |
| 30 Sep 2005 | £187,000 |
No other historical records.
14, Old Forge End, Sandhurst GU47 9DY
| Today | See what it's worth now |
| 17 Apr 2026 | £592,000 |
| 25 Oct 2002 | £250,000 |
Extensions and planning permission in GU47
See planning approval stats, extension build costs and value added estimates.

4, Chaffinch Close, College Town, Sandhurst GU47 0XX
| Today | See what it's worth now |
| 8 Apr 2026 | £505,000 |
| 14 Aug 1995 | £86,000 |
No other historical records.
22 Sanibel House, Park Road, Sandhurst GU47 9AA
| Today | See what it's worth now |
| 1 Apr 2026 | £717,500 |
| 30 Nov 2010 | £367,500 |
2, Long Mickle, Sandhurst GU47 8QW
| Today | See what it's worth now |
| 31 Mar 2026 | £629,000 |
| 19 Sep 1996 | £115,000 |
No other historical records.
17, York Way, Sandhurst GU47 9DG

| Today | See what it's worth now |
| 26 Mar 2026 | £445,000 |
| 26 Mar 2018 | £300,000 |
No other historical records.
15, Landseer Close, College Town, Sandhurst GU47 0FQ
| Today | See what it's worth now |
| 20 Mar 2026 | £740,000 |
| 7 May 1999 | £145,000 |
No other historical records.
4, Crake Place, College Town, Sandhurst GU47 0YA
| Today | See what it's worth now |
| 18 Mar 2026 | £422,000 |
| 24 Jul 2006 | £222,500 |
14, College Crescent, College Town, Sandhurst GU47 0RF

| Today | See what it's worth now |
| 12 Mar 2026 | £465,000 |
| 1 Nov 2012 | £290,000 |
32, Wyatt Court, Yorktown Road, College Town, Sandhurst GU47 0NU
| Today | See what it's worth now |
| 9 Mar 2026 | £137,500 |
| 1 Dec 2014 | £137,500 |
58, Yeovil Road, Owlsmoor, Sandhurst GU47 0TE
| Today | See what it's worth now |
| 6 Mar 2026 | £920,000 |
| 20 Mar 2020 | £475,000 |
No other historical records.
14, Whitmore Close, Owlsmoor, Sandhurst GU47 0SE

| Today | See what it's worth now |
| 6 Mar 2026 | £450,000 |
| 26 Mar 1999 | £111,500 |
27, Birkbeck Place, Owlsmoor, Sandhurst GU47 0UL
| Today | See what it's worth now |
| 27 Feb 2026 | £320,000 |
| 5 Jun 2019 | £290,000 |
12, Park Road, Sandhurst GU47 9AA

| Today | See what it's worth now |
| 27 Feb 2026 | £690,000 |
| 30 Oct 2015 | £495,000 |
221a, College Road, College Town, Sandhurst GU47 0RG
| Today | See what it's worth now |
| 27 Feb 2026 | £624,000 |
| 27 Feb 2012 | £385,000 |
No other historical records.
43, Harvard Road, Owlsmoor, Sandhurst GU47 0UY
| Today | See what it's worth now |
| 27 Feb 2026 | £465,000 |
| 26 May 2017 | £367,500 |
No other historical records.
27, Cherrytree Close, Owlsmoor, Sandhurst GU47 0UH
| Today | See what it's worth now |
| 26 Feb 2026 | £370,000 |
| 28 Apr 2022 | £342,000 |
62, Longdown Road, Sandhurst GU47 8QQ

| Today | See what it's worth now |
| 24 Feb 2026 | £485,000 |
| 17 Feb 2021 | £418,000 |
14, New Road, Sandhurst GU47 8EF
| Today | See what it's worth now |
| 17 Feb 2026 | £470,000 |
| 13 Mar 2020 | £380,000 |
4, Thorburn Chase, College Town, Sandhurst GU47 0GF
| Today | See what it's worth now |
| 13 Feb 2026 | £254,000 |
| 1 Aug 1997 | £60,000 |
No other historical records.
The Byre, Ambarrow Farm Courtyard, Ambarrow Lane, Sandhurst GU47 8JE
| Today | See what it's worth now |
| 11 Feb 2026 | £690,000 |
| 7 Apr 2011 | £425,000 |
27, New Road, Sandhurst GU47 8EF
| Today | See what it's worth now |
| 9 Feb 2026 | £548,000 |
No other historical records.
Source Acknowledgement: © Crown copyright. England and Wales house price data is publicly available information produced by the HM Land Registry.This material was last updated on 9 July 2026. It covers the period from 1 January 1995 to 30 April 2026 and contains property transactions which have been registered during that period. Contains HM Land Registry data © Crown copyright and database right 2026. This data is licensed under the Open Government Licence v3.0.
Disclaimer: Rightmove.co.uk provides this HM Land Registry data "as is". The burden for fitness of the data relies completely with the user and is provided for informational purposes only. No warranty, express or implied, is given relating to the accuracy of content of the HM Land Registry data and Rightmove does not accept any liability for error or omission. If you have found an error with the data or need further information please contact HM Land Registry.
Permitted Use: Viewers of this Information are granted permission to access this Crown copyright material and to download it onto electronic, magnetic, optical or similar storage media provided that such activities are for private research, study or in-house use only. Any other use of the material requires the formal written permission of Land Registry which can be requested from us, and is subject to an additional licence and associated charge.
Rightmove takes no liability for your use of, or reliance on, Rightmove's Instant Valuation due to the limitations of our tracking tool listed here. Use of this tool is taken entirely at your own risk. All rights reserved.