
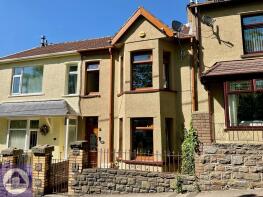
House Prices in Gelli Crug
House prices in Gelli Crug have an overall average of £139,857 over the last year.
The majority of properties sold in Gelli Crug during the last year were terraced properties, selling for an average price of £121,329. Semi-detached properties sold for an average of £152,143, with detached properties fetching £294,375.
Overall, the historical sold prices in Gelli Crug over the last year were 6% up on the previous year and 7% up on the 2023 peak of £131,271.
Properties Sold
20, Evelyn Street, Abertillery NP13 1EL
| Today | See what it's worth now |
| 24 Mar 2026 | £130,000 |
| 4 Mar 1999 | £11,000 |
No other historical records.
43, Rhiw Parc Road, Abertillery NP13 1EW
| Today | See what it's worth now |
| 24 Mar 2026 | £112,000 |
| 1 Aug 2018 | £69,500 |
16, Evelyn Street, Abertillery NP13 1EL
| Today | See what it's worth now |
| 23 Mar 2026 | £155,000 |
| 21 Jun 2024 | £140,000 |
4, Park View Terrace, Carlyle Street, Abertillery NP13 1UA

| Today | See what it's worth now |
| 13 Mar 2026 | £68,000 |
| 5 Mar 2004 | £46,000 |
No other historical records.
3, Winifred Terrace, Cwmtillery, Abertillery NP13 1RB
| Today | See what it's worth now |
| 4 Mar 2026 | £172,500 |
| 22 Sep 2022 | £105,500 |
No other historical records.
35, Castle Street, Abertillery NP13 1DS
| Today | See what it's worth now |
| 27 Feb 2026 | £105,000 |
| 16 Dec 2010 | £52,000 |
No other historical records.
73, Pantypwdyn Road, Abertillery NP13 1BD
| Today | See what it's worth now |
| 26 Feb 2026 | £125,500 |
| 7 Aug 2009 | £100,000 |
54, Arael View, Abertillery NP13 1ST
| Today | See what it's worth now |
| 18 Feb 2026 | £80,000 |
| 28 Sep 2006 | £45,000 |
No other historical records.
2, Rising Sun Court, Ty Dan Y Wal Road, Cwmtillery, Abertillery NP13 1RN
| Today | See what it's worth now |
| 13 Feb 2026 | £380,000 |
No other historical records.
37, Rhiw Parc Road, Abertillery NP13 1EW
| Today | See what it's worth now |
| 13 Feb 2026 | £110,500 |
| 31 Jan 2025 | £95,000 |
40, Carlyle Street, Abertillery NP13 1UF

| Today | See what it's worth now |
| 30 Jan 2026 | £105,000 |
| 30 Sep 2021 | £95,000 |
25, Victoria Street, Abertillery NP13 1PQ
| Today | See what it's worth now |
| 29 Jan 2026 | £96,000 |
| 11 Jan 2000 | £19,995 |
No other historical records.
14, Hill Street, Abertillery NP13 1DU
| Today | See what it's worth now |
| 23 Jan 2026 | £75,000 |
No other historical records.
12, Clynmawr Street, Abertillery NP13 1NN
| Today | See what it's worth now |
| 23 Jan 2026 | £170,000 |
| 2 Oct 2015 | £112,000 |
51, Glandwr Street, Abertillery NP13 1TY
| Today | See what it's worth now |
| 19 Jan 2026 | £150,000 |
No other historical records.
63, Alma Street, Abertillery NP13 1QB
| Today | See what it's worth now |
| 15 Jan 2026 | £170,000 |
| 30 Jan 2015 | £74,950 |
No other historical records.
27, Grosvenor Road, Abertillery NP13 1PA
| Today | See what it's worth now |
| 14 Jan 2026 | £148,000 |
| 28 May 1999 | £31,000 |
No other historical records.
19, Neuadd Street, Abertillery NP13 1NP
| Today | See what it's worth now |
| 14 Jan 2026 | £108,000 |
| 11 Mar 2011 | £62,000 |
The Old Spillers, Ty Bryn Road, Abertillery NP13 1PH
| Today | See what it's worth now |
| 19 Dec 2025 | £215,000 |
| 14 Mar 2022 | £212,000 |
No other historical records.
63, Hill Crest View, Cwmtillery, Abertillery NP13 1LX
| Today | See what it's worth now |
| 18 Dec 2025 | £150,000 |
| 12 Oct 2007 | £66,000 |
No other historical records.
70, Duke Street, Abertillery NP13 1BB
| Today | See what it's worth now |
| 5 Dec 2025 | £150,000 |
| 23 Nov 2007 | £111,000 |
45, Glandwr Street, Abertillery NP13 1TY
| Today | See what it's worth now |
| 3 Dec 2025 | £103,000 |
| 18 Aug 1995 | £25,000 |
No other historical records.
37, Queen Street, Abertillery NP13 1AP
| Today | See what it's worth now |
| 21 Nov 2025 | £97,500 |
| 21 Sep 2020 | £75,000 |

Source Acknowledgement: © Crown copyright. England and Wales house price data is publicly available information produced by the HM Land Registry.This material was last updated on 9 July 2026. It covers the period from 1 January 1995 to 30 April 2026 and contains property transactions which have been registered during that period. Contains HM Land Registry data © Crown copyright and database right 2026. This data is licensed under the Open Government Licence v3.0.
Disclaimer: Rightmove.co.uk provides this HM Land Registry data "as is". The burden for fitness of the data relies completely with the user and is provided for informational purposes only. No warranty, express or implied, is given relating to the accuracy of content of the HM Land Registry data and Rightmove does not accept any liability for error or omission. If you have found an error with the data or need further information please contact HM Land Registry.
Permitted Use: Viewers of this Information are granted permission to access this Crown copyright material and to download it onto electronic, magnetic, optical or similar storage media provided that such activities are for private research, study or in-house use only. Any other use of the material requires the formal written permission of Land Registry which can be requested from us, and is subject to an additional licence and associated charge.
Rightmove takes no liability for your use of, or reliance on, Rightmove's Instant Valuation due to the limitations of our tracking tool listed here. Use of this tool is taken entirely at your own risk. All rights reserved.