
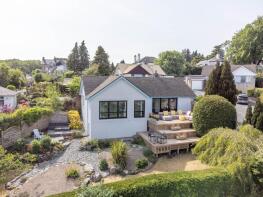
House Prices in Grange-Over-Sands
House prices in Grange-Over-Sands have an overall average of £313,280 over the last year.
The majority of properties sold in Grange-Over-Sands during the last year were flats, selling for an average price of £179,304. Detached properties sold for an average of £463,429, with semi-detached properties fetching £330,000.
Overall, the historical sold prices in Grange-Over-Sands over the last year were similar to the previous year and 5% up on the 2023 peak of £298,525.
Properties Sold
33 Windrush, Carter Road, Grange-over-sands LA11 7AG

| Today | See what it's worth now |
| 17 Apr 2026 | £415,000 |
| 10 Dec 1998 | £125,000 |
No other historical records.
Blakestone, Charney Road, Grange-over-sands LA11 6BP
| Today | See what it's worth now |
| 15 Apr 2026 | £370,000 |
| 1 Jun 2022 | £330,000 |
5, Kents Bank House, Kentsford Road, Grange-over-sands LA11 7BB
| Today | See what it's worth now |
| 10 Apr 2026 | £415,000 |
| 16 Jul 2020 | £300,000 |
4, Crown Hill, Main Street, Grange-over-sands LA11 6AB

| Today | See what it's worth now |
| 31 Mar 2026 | £245,000 |
| 19 Jul 2024 | £220,000 |
18, Grayrigge Court, Kents Bank Road, Grange-over-sands LA11 7HD
| Today | See what it's worth now |
| 31 Mar 2026 | £75,000 |
| 29 Aug 2014 | £67,500 |
11, Graythwaite Court, Fernhill Road, Grange-over-sands LA11 7BN
| Today | See what it's worth now |
| 25 Mar 2026 | £332,000 |
| 25 Jun 2021 | £325,000 |
15, The Old Nurseries, Grange-over-sands LA11 7AD
| Today | See what it's worth now |
| 24 Mar 2026 | £305,000 |
No other historical records.
1 Seacroft, Yew Tree Road, Grange-over-sands LA11 7AA
| Today | See what it's worth now |
| 16 Mar 2026 | £405,000 |
| 19 Apr 2007 | £315,000 |
No other historical records.
Fox Cottage, Allithwaite Road, Grange-over-sands LA11 7EN
| Today | See what it's worth now |
| 3 Mar 2026 | £420,000 |
| 26 May 2017 | £285,000 |
8, Abbots Close, Grange-over-sands LA11 7BZ
| Today | See what it's worth now |
| 13 Feb 2026 | £175,000 |
| 12 May 2004 | £200,000 |
No other historical records.
Lynboro, Windermere Road, Grange-over-sands LA11 6JT
| Today | See what it's worth now |
| 13 Feb 2026 | £450,000 |
No other historical records.
Flat 1, Greystones, Kents Bank Road, Grange-over-sands LA11 7EF
| Today | See what it's worth now |
| 16 Jan 2026 | £295,000 |
| 31 Mar 2023 | £270,000 |
No other historical records.
58, Priory Lane, Grange-over-sands LA11 7BJ
| Today | See what it's worth now |
| 6 Jan 2026 | £375,000 |
| 29 Sep 2000 | £160,000 |
53, Priory Lane, Grange-over-sands LA11 7BJ
| Today | See what it's worth now |
| 6 Jan 2026 | £435,000 |
| 6 Sep 2004 | £249,000 |
No other historical records.
46 Red Roofs, Cart Lane, Grange-over-sands LA11 7AF
| Today | See what it's worth now |
| 18 Dec 2025 | £315,000 |
| 28 Sep 2017 | £290,000 |
Flat 6, The Regent, Main Street, Grange-over-sands LA11 6DY
| Today | See what it's worth now |
| 18 Dec 2025 | £229,000 |
| 24 Oct 2019 | £187,000 |
21, Strand Court, The Esplanade, Grange-over-sands LA11 7HH

| Today | See what it's worth now |
| 18 Dec 2025 | £70,000 |
| 28 Jan 2015 | £47,500 |
61, Kentsford Road, Grange-over-sands LA11 7BB
| Today | See what it's worth now |
| 18 Dec 2025 | £350,000 |
| 16 Jun 2021 | £280,000 |
No other historical records.
25, Grayrigge Court, Kents Bank Road, Grange-over-sands LA11 7HD
| Today | See what it's worth now |
| 12 Dec 2025 | £94,000 |
| 27 May 2011 | £105,000 |
The Eaves, Charney Well Lane, Grange-over-sands LA11 6DB
| Today | See what it's worth now |
| 5 Dec 2025 | £550,000 |
| 16 Oct 1998 | £143,000 |
No other historical records.
1a, 1, Thornfield Road, Grange-over-sands LA11 7DR
| Today | See what it's worth now |
| 5 Dec 2025 | £176,000 |
| 24 Mar 2021 | £153,000 |
Cragside, Highfield Road, Grange-over-sands LA11 7JB
| Today | See what it's worth now |
| 25 Nov 2025 | £440,000 |
| 4 Aug 2014 | £315,000 |
Flat 1, 7, Thornfield Road, Grange-over-sands LA11 7DR
| Today | See what it's worth now |
| 21 Nov 2025 | £140,000 |
| 30 Sep 2021 | £105,000 |
Source Acknowledgement: © Crown copyright. England and Wales house price data is publicly available information produced by the HM Land Registry.This material was last updated on 9 July 2026. It covers the period from 1 January 1995 to 30 April 2026 and contains property transactions which have been registered during that period. Contains HM Land Registry data © Crown copyright and database right 2026. This data is licensed under the Open Government Licence v3.0.
Disclaimer: Rightmove.co.uk provides this HM Land Registry data "as is". The burden for fitness of the data relies completely with the user and is provided for informational purposes only. No warranty, express or implied, is given relating to the accuracy of content of the HM Land Registry data and Rightmove does not accept any liability for error or omission. If you have found an error with the data or need further information please contact HM Land Registry.
Permitted Use: Viewers of this Information are granted permission to access this Crown copyright material and to download it onto electronic, magnetic, optical or similar storage media provided that such activities are for private research, study or in-house use only. Any other use of the material requires the formal written permission of Land Registry which can be requested from us, and is subject to an additional licence and associated charge.
Rightmove takes no liability for your use of, or reliance on, Rightmove's Instant Valuation due to the limitations of our tracking tool listed here. Use of this tool is taken entirely at your own risk. All rights reserved.