
House Prices in Grindley Lane
House prices in Grindley Lane have an overall average of £335,493 over the last year.
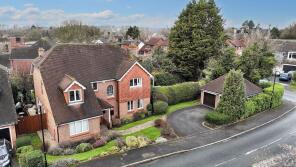
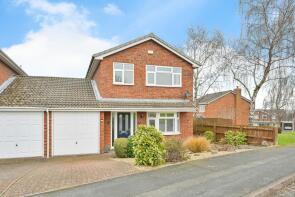
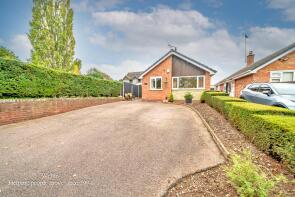
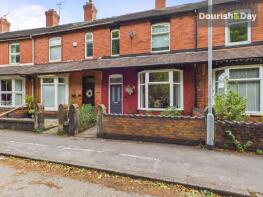
The majority of properties sold in Grindley Lane during the last year were detached properties, selling for an average price of £413,647. Semi-detached properties sold for an average of £261,404, with terraced properties fetching £272,893.
Overall, the historical sold prices in Grindley Lane over the last year were 8% up on the previous year and 7% up on the 2023 peak of £314,775.
Properties Sold
28, Canberra Drive, Beaconside, Stafford ST16 3PX
| Today | See what it's worth now |
| 15 Apr 2026 | £250,000 |
| 22 Jun 2007 | £175,000 |
No other historical records.
The Stables, Lymers Lane, Fradswell, Stafford ST18 0GX

| Today | See what it's worth now |
| 2 Apr 2026 | £320,000 |
| 11 Nov 2022 | £330,000 |
20, Hawkesmore Drive, Little Haywood, Stafford ST18 0UA
| Today | See what it's worth now |
| 27 Mar 2026 | £280,000 |
| 12 Dec 2003 | £139,950 |
5, Abbeyfields, Great Haywood, Stafford ST18 0SD
| Today | See what it's worth now |
| 26 Mar 2026 | £300,000 |
| 2 Jul 2010 | £180,000 |
6, High Chase Rise, Little Haywood, Stafford ST18 0TY
| Today | See what it's worth now |
| 20 Mar 2026 | £421,000 |
| 16 Oct 2009 | £223,000 |
No other historical records.
2, Meadowbank Avenue, Weston, Stafford ST18 0HE
| Today | See what it's worth now |
| 20 Mar 2026 | £585,000 |
| 25 Aug 2005 | £325,000 |
10, Longhurst Drive, Kingston Hill, Stafford ST16 3RG
| Today | See what it's worth now |
| 18 Mar 2026 | £293,500 |
| 19 Nov 2021 | £250,000 |
16, Castlemill Court, Castlemill Close, Weston, Stafford ST18 0GJ
| Today | See what it's worth now |
| 2 Mar 2026 | £122,500 |
| 2 May 2012 | £122,000 |
Halfway House Cottage, Hanyards Lane, Tixall, Stafford ST18 0XZ
| Today | See what it's worth now |
| 2 Mar 2026 | £550,000 |
No other historical records.
12, Mill Lane, Great Haywood, Stafford ST18 0RJ
| Today | See what it's worth now |
| 2 Mar 2026 | £350,000 |
| 17 Oct 2016 | £210,000 |
4, Greengate Apartments, Greengate Walk, Stafford ST16 2HU
| Today | See what it's worth now |
| 27 Feb 2026 | £87,000 |
| 17 Jun 2016 | £120,000 |
Brancote Lodge, Tixall Road, Tixall, Stafford ST18 0XX
| Today | See what it's worth now |
| 27 Feb 2026 | £665,000 |
| 14 Sep 2022 | £627,000 |
148, Corporation Street, Stafford ST16 3LS
| Today | See what it's worth now |
| 27 Feb 2026 | £235,000 |
| 27 Jan 2025 | £162,000 |
No other historical records.
11, Penn Croft, Little Haywood, Stafford ST18 0UY
| Today | See what it's worth now |
| 27 Feb 2026 | £545,000 |
No other historical records.
25, Priory Drive, Little Haywood, Stafford ST18 0QL
| Today | See what it's worth now |
| 27 Feb 2026 | £397,500 |
| 21 Sep 2012 | £250,000 |
9, Clifton Drive, Kingston Hill, Stafford ST16 3UZ
| Today | See what it's worth now |
| 27 Feb 2026 | £285,000 |
| 9 Oct 2023 | £295,000 |
No other historical records.
6a, Dartmouth Street, Littleworth, Stafford ST16 3TU
| Today | See what it's worth now |
| 27 Feb 2026 | £260,000 |
| 17 Jan 2022 | £185,000 |
138, Tixall Road, Kingston Hill, Stafford ST16 3UD
| Today | See what it's worth now |
| 27 Feb 2026 | £400,000 |
| 5 Mar 2004 | £100,000 |
34, Hillside Drive, Little Haywood, Stafford ST18 0NN
| Today | See what it's worth now |
| 26 Feb 2026 | £280,000 |
| 12 Nov 2014 | £180,000 |
54, Little Tixall Lane, Great Haywood, Stafford ST18 0SE
| Today | See what it's worth now |
| 26 Feb 2026 | £427,500 |
| 12 Dec 2013 | £265,000 |
88, Weston Road, Stafford ST16 3RW
| Today | See what it's worth now |
| 20 Feb 2026 | £163,000 |
| 15 Dec 2023 | £150,000 |
Burston Cottage Farm, Lichfield Road, Burston, Stafford ST18 0DP
| Today | See what it's worth now |
| 19 Feb 2026 | £352,000 |
No other historical records.
17, Salt Works Lane, Weston, Stafford ST18 0LW
| Today | See what it's worth now |
| 9 Feb 2026 | £245,000 |
| 13 Jan 2023 | £210,000 |

Source Acknowledgement: © Crown copyright. England and Wales house price data is publicly available information produced by the HM Land Registry.This material was last updated on 9 July 2026. It covers the period from 1 January 1995 to 30 April 2026 and contains property transactions which have been registered during that period. Contains HM Land Registry data © Crown copyright and database right 2026. This data is licensed under the Open Government Licence v3.0.
Disclaimer: Rightmove.co.uk provides this HM Land Registry data "as is". The burden for fitness of the data relies completely with the user and is provided for informational purposes only. No warranty, express or implied, is given relating to the accuracy of content of the HM Land Registry data and Rightmove does not accept any liability for error or omission. If you have found an error with the data or need further information please contact HM Land Registry.
Permitted Use: Viewers of this Information are granted permission to access this Crown copyright material and to download it onto electronic, magnetic, optical or similar storage media provided that such activities are for private research, study or in-house use only. Any other use of the material requires the formal written permission of Land Registry which can be requested from us, and is subject to an additional licence and associated charge.
Rightmove takes no liability for your use of, or reliance on, Rightmove's Instant Valuation due to the limitations of our tracking tool listed here. Use of this tool is taken entirely at your own risk. All rights reserved.