
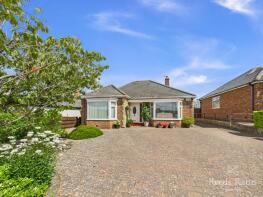
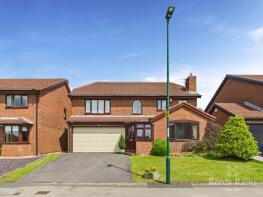
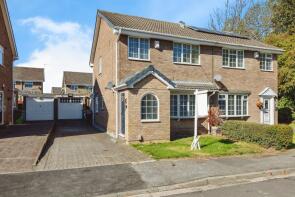
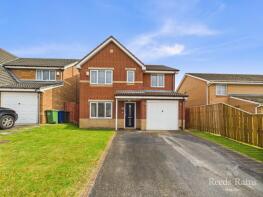
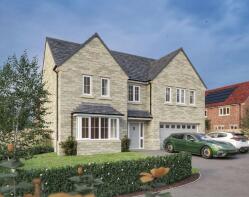
House Prices in Guisborough
House prices in Guisborough have an overall average of £210,348 over the last year.
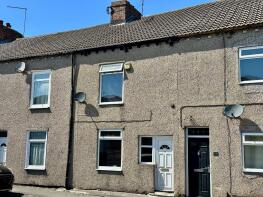
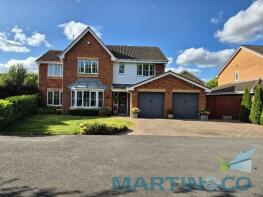
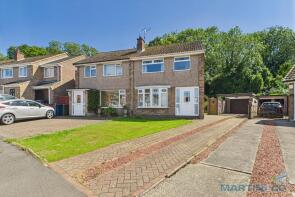
The majority of properties sold in Guisborough during the last year were semi-detached properties, selling for an average price of £198,435. Detached properties sold for an average of £310,366, with terraced properties fetching £131,958.
Overall, the historical sold prices in Guisborough over the last year were 8% down on the previous year and 2% up on the 2021 peak of £206,653.
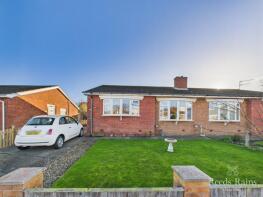
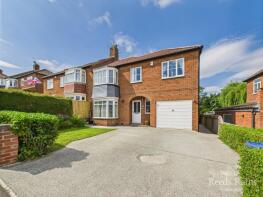
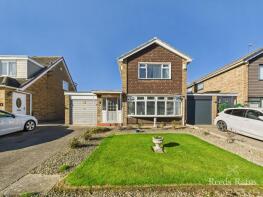
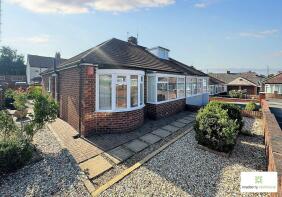
Properties Sold
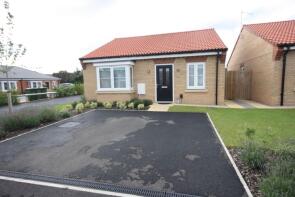
29, Severn Drive, Guisborough TS14 8AU
| Today | See what it's worth now |
| 17 Apr 2026 | £320,000 |
| 22 Oct 2007 | £228,000 |
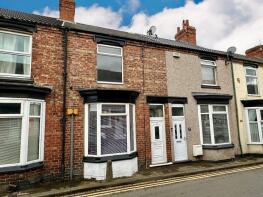
94, Church Street, Guisborough TS14 6BX
| Today | See what it's worth now |
| 10 Apr 2026 | £105,000 |
| 23 Oct 1998 | £44,500 |
No other historical records.
47, Brambling Drive, Guisborough TS14 8LY
| Today | See what it's worth now |
| 8 Apr 2026 | £417,000 |
| 5 Feb 2021 | £333,950 |
No other historical records.
4, Lucia Lane, Guisborough TS14 8BY

| Today | See what it's worth now |
| 27 Mar 2026 | £375,000 |
| 30 Nov 2018 | £240,000 |
No other historical records.
12, Whaddon Chase, Guisborough TS14 7NQ
| Today | See what it's worth now |
| 27 Mar 2026 | £245,000 |
| 12 Nov 2001 | £68,950 |
No other historical records.
8, Morrison Road, Guisborough TS14 6DQ
| Today | See what it's worth now |
| 25 Mar 2026 | £165,000 |
| 8 Oct 2011 | £90,000 |
8, Spring Lodge Gardens, Guisborough TS14 8DE

| Today | See what it's worth now |
| 20 Mar 2026 | £336,995 |
| 22 Feb 2013 | £249,950 |
No other historical records.
61, Severn Drive, Guisborough TS14 8AT
| Today | See what it's worth now |
| 20 Mar 2026 | £300,000 |
| 6 Sep 2011 | £245,000 |
14, Byland Close, Guisborough TS14 7AT

| Today | See what it's worth now |
| 20 Mar 2026 | £200,000 |
| 11 Oct 2018 | £145,000 |
No other historical records.
11, Kingfisher Drive, Guisborough TS14 8HS
| Today | See what it's worth now |
| 13 Mar 2026 | £185,000 |
No other historical records.
14, Carmel Gardens, Guisborough TS14 6EZ
| Today | See what it's worth now |
| 12 Mar 2026 | £155,000 |
| 29 Sep 2023 | £150,000 |
76, Great Auk, Guisborough TS14 8PQ
| Today | See what it's worth now |
| 6 Mar 2026 | £330,000 |
| 20 Sep 1996 | £112,000 |
No other historical records.
11, Sinnington Close, Guisborough TS14 7LB
| Today | See what it's worth now |
| 27 Feb 2026 | £230,000 |
| 24 Jun 2004 | £135,000 |
No other historical records.
23, Thirlby Way, Guisborough TS14 6GN
| Today | See what it's worth now |
| 27 Feb 2026 | £280,000 |
| 28 Sep 2021 | £245,000 |
78, Belmangate, Guisborough TS14 7AQ

| Today | See what it's worth now |
| 26 Feb 2026 | £232,000 |
| 21 Jun 2021 | £105,000 |
No other historical records.
42, Eskdale Terrace, Guisborough TS14 6EQ
| Today | See what it's worth now |
| 23 Feb 2026 | £108,000 |
| 16 Jun 2004 | £90,000 |
16, Nightingale Road, Guisborough TS14 8HA
| Today | See what it's worth now |
| 20 Feb 2026 | £402,500 |
| 24 Jun 2016 | £314,950 |
No other historical records.
34, Bolckow Street, Guisborough TS14 6EN
| Today | See what it's worth now |
| 18 Feb 2026 | £114,999 |
| 14 Jun 2023 | £98,750 |
3, Allerston Way, Guisborough TS14 6GA
| Today | See what it's worth now |
| 6 Feb 2026 | £250,000 |
| 30 May 2025 | £500,000 |
90, Whitby Avenue, Guisborough TS14 7BA
| Today | See what it's worth now |
| 4 Feb 2026 | £194,000 |
| 19 Jun 2014 | £175,000 |
17, Waxwing Close, Guisborough TS14 8ND
| Today | See what it's worth now |
| 4 Feb 2026 | £240,000 |
| 9 May 2018 | £179,950 |
No other historical records.
3, Reid Terrace, Guisborough TS14 6EB
| Today | See what it's worth now |
| 2 Feb 2026 | £110,000 |
| 8 Jan 2021 | £82,500 |
48, Allison Street, Guisborough TS14 6NX
| Today | See what it's worth now |
| 2 Feb 2026 | £84,000 |
| 13 Nov 2006 | £95,000 |
No other historical records.
Source Acknowledgement: © Crown copyright. England and Wales house price data is publicly available information produced by the HM Land Registry.This material was last updated on 9 July 2026. It covers the period from 1 January 1995 to 30 April 2026 and contains property transactions which have been registered during that period. Contains HM Land Registry data © Crown copyright and database right 2026. This data is licensed under the Open Government Licence v3.0.
Disclaimer: Rightmove.co.uk provides this HM Land Registry data "as is". The burden for fitness of the data relies completely with the user and is provided for informational purposes only. No warranty, express or implied, is given relating to the accuracy of content of the HM Land Registry data and Rightmove does not accept any liability for error or omission. If you have found an error with the data or need further information please contact HM Land Registry.
Permitted Use: Viewers of this Information are granted permission to access this Crown copyright material and to download it onto electronic, magnetic, optical or similar storage media provided that such activities are for private research, study or in-house use only. Any other use of the material requires the formal written permission of Land Registry which can be requested from us, and is subject to an additional licence and associated charge.
Rightmove takes no liability for your use of, or reliance on, Rightmove's Instant Valuation due to the limitations of our tracking tool listed here. Use of this tool is taken entirely at your own risk. All rights reserved.