
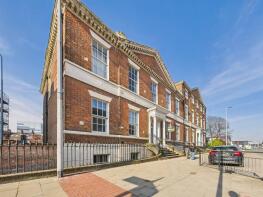
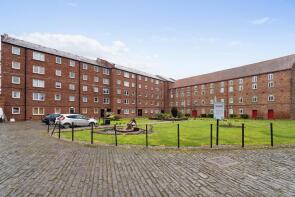
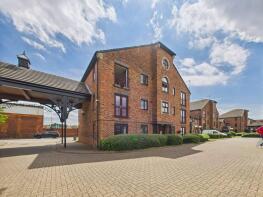
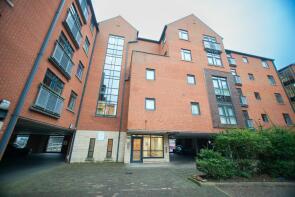
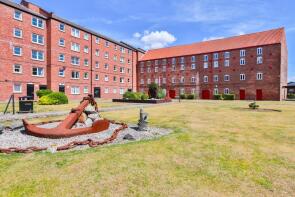
House Prices in HU1
House prices in HU1 have an overall average of £136,787 over the last year.
The majority of properties sold in HU1 during the last year were flats, selling for an average price of £120,359. Semi-detached properties sold for an average of £190,000, with terraced properties fetching £215,000.
Overall, the historical sold prices in HU1 over the last year were 13% down on the previous year and 10% down on the 2022 peak of £151,951.
Properties Sold
Flat 2, 83, George Street, Hull HU1 3BN
| Today | See what it's worth now |
| 12 Mar 2026 | £95,000 |
| 14 May 2012 | £113,000 |
No other historical records.
9, Phoenix House, High Street, Hull HU1 1NR
| Today | See what it's worth now |
| 20 Feb 2026 | £68,996 |
| 22 Aug 1997 | £30,000 |
No other historical records.
Apartment 419, 75 The Glass House, Queens Dock Avenue, Hull HU1 3FA
| Today | See what it's worth now |
| 15 Jan 2026 | £380,000 |
No other historical records.
Extensions and planning permission in HU1
See planning approval stats, extension build costs and value added estimates.

4a, Pease Court, High Street, Hull HU1 1NG
| Today | See what it's worth now |
| 19 Dec 2025 | £42,000 |
| 6 Nov 2015 | £50,000 |
No other historical records.
Flat 22, Liberty House, Liberty Lane, Hull HU1 1AY
| Today | See what it's worth now |
| 12 Dec 2025 | £130,000 |
| 12 Mar 2021 | £140,000 |
No other historical records.
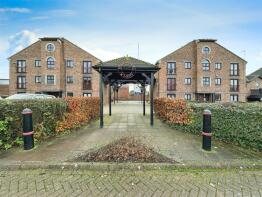
43, Kingston Wharf, Hull HU1 2ES

| Today | See what it's worth now |
| 14 Nov 2025 | £140,000 |
| 9 Mar 2016 | £94,950 |
No other historical records.
7, Kingston Wharf, Hull HU1 2ES
| Today | See what it's worth now |
| 14 Nov 2025 | £134,000 |
| 29 Jul 2022 | £125,000 |
Apartment 37, 52 58 Trinity Wharf, High Street, Hull HU1 1QE
| Today | See what it's worth now |
| 12 Nov 2025 | £68,000 |
| 12 Jan 2007 | £95,000 |
No other historical records.
10, Admirals Croft, Hull HU1 2DR
| Today | See what it's worth now |
| 17 Oct 2025 | £195,000 |
| 16 Jul 2002 | £64,950 |
No other historical records.
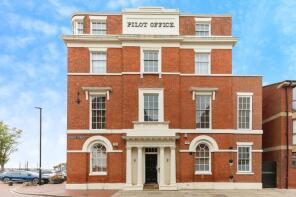
Apartment 7, 50 Pilot Office, Queen Street, Hull HU1 1UJ

| Today | See what it's worth now |
| 15 Oct 2025 | £170,000 |
| 14 Feb 2007 | £290,000 |
No other historical records.
307, Phoenix House, High Street, Hull HU1 1NR
| Today | See what it's worth now |
| 6 Oct 2025 | £55,000 |
| 30 Oct 2007 | £75,000 |
Flat H, 190 Lawson Court, High Street, Hull HU1 1HA
| Today | See what it's worth now |
| 12 Sep 2025 | £75,000 |
| 6 Jun 2006 | £70,000 |
No other historical records.
1, Halyard Croft, Hull HU1 2EP
| Today | See what it's worth now |
| 9 Sep 2025 | £200,000 |
| 23 Apr 2021 | £155,000 |
28, Marine Wharf, Hull HU1 2TY
| Today | See what it's worth now |
| 5 Sep 2025 | £112,500 |
| 13 Apr 2006 | £95,000 |
No other historical records.
13, Halyard Croft, Hull HU1 2EP
| Today | See what it's worth now |
| 29 Aug 2025 | £185,000 |
| 25 Sep 2023 | £167,500 |
Apartment 3, Pilot Office, Queen Street, Kingston Upon Hull HU1 1UJ
| Today | See what it's worth now |
| 29 Aug 2025 | £168,000 |
| 15 Dec 2006 | £185,000 |
No other historical records.
6, Kingston Wharf, Hull HU1 2ES
| Today | See what it's worth now |
| 31 Jul 2025 | £137,250 |
| 31 Oct 1997 | £55,000 |
No other historical records.
10, 6 Victoria Chambers, Bowlalley Lane, Hull HU1 1XR
| Today | See what it's worth now |
| 30 Jul 2025 | £50,000 |
| 28 Sep 2004 | £99,950 |
No other historical records.
1, Horners Square, Hull HU1 1AP
| Today | See what it's worth now |
| 11 Jul 2025 | £230,000 |
| 6 Nov 2020 | £264,995 |
No other historical records.
52, Grammar School Yard, Hull HU1 1SE
| Today | See what it's worth now |
| 9 Jul 2025 | £100,000 |
| 30 May 2023 | £90,000 |
Flat 9, Suffolk House, Silver Street, Kingston Upon Hull HU1 1JG
| Today | See what it's worth now |
| 9 Jun 2025 | £144,000 |
No other historical records.
11, Scotts Square, Hull HU1 1AU

| Today | See what it's worth now |
| 28 May 2025 | £270,000 |
| 29 Oct 2021 | £266,995 |
No other historical records.
7, Blanket Row, Hull HU1 1AX
| Today | See what it's worth now |
| 19 May 2025 | £277,000 |
| 30 Apr 2021 | £265,000 |
No other historical records.


Source Acknowledgement: © Crown copyright. England and Wales house price data is publicly available information produced by the HM Land Registry.This material was last updated on 9 July 2026. It covers the period from 1 January 1995 to 30 April 2026 and contains property transactions which have been registered during that period. Contains HM Land Registry data © Crown copyright and database right 2026. This data is licensed under the Open Government Licence v3.0.
Disclaimer: Rightmove.co.uk provides this HM Land Registry data "as is". The burden for fitness of the data relies completely with the user and is provided for informational purposes only. No warranty, express or implied, is given relating to the accuracy of content of the HM Land Registry data and Rightmove does not accept any liability for error or omission. If you have found an error with the data or need further information please contact HM Land Registry.
Permitted Use: Viewers of this Information are granted permission to access this Crown copyright material and to download it onto electronic, magnetic, optical or similar storage media provided that such activities are for private research, study or in-house use only. Any other use of the material requires the formal written permission of Land Registry which can be requested from us, and is subject to an additional licence and associated charge.
Rightmove takes no liability for your use of, or reliance on, Rightmove's Instant Valuation due to the limitations of our tracking tool listed here. Use of this tool is taken entirely at your own risk. All rights reserved.