
House Prices in Hartlebury
House prices in Hartlebury have an overall average of £369,250 over the last year.
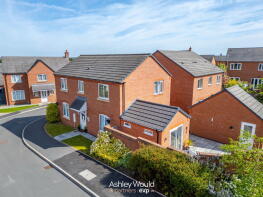
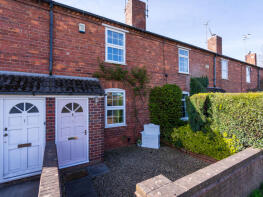
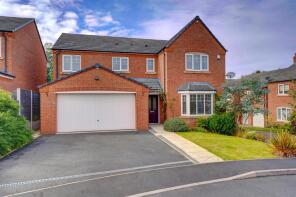
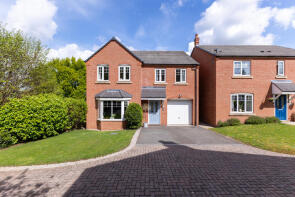
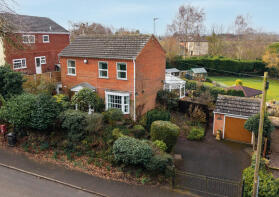
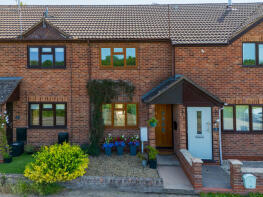
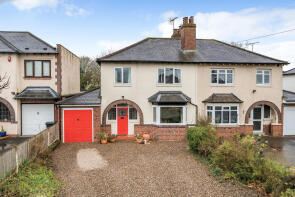
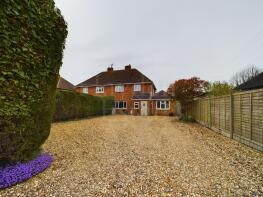
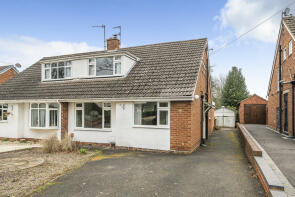
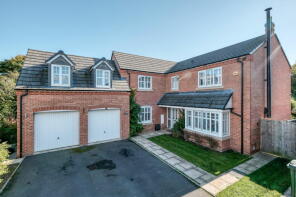
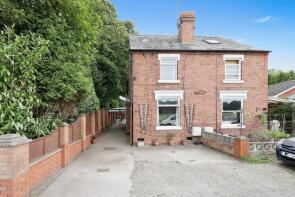
The majority of properties sold in Hartlebury during the last year were detached properties, selling for an average price of £432,111. Semi-detached properties sold for an average of £356,188, with terraced properties fetching £240,875.
Overall, the historical sold prices in Hartlebury over the last year were similar to the previous year and 20% down on the 2022 peak of £463,984.
Properties Sold
3, Bolas Avenue, Kidderminster DY11 7TX
| Today | See what it's worth now |
| 12 Dec 2025 | £417,500 |
| 12 Aug 2016 | £305,000 |
No other historical records.
2, Catherine Cottages, Droitwich Road, Torton, Kidderminster DY10 4EL
| Today | See what it's worth now |
| 28 Nov 2025 | £218,000 |
| 31 Jul 2015 | £132,950 |
10, Bolas Avenue, Kidderminster DY11 7TX
| Today | See what it's worth now |
| 27 Nov 2025 | £595,000 |
| 26 May 2017 | £439,995 |
No other historical records.
Parkfield Cottage, Inn Lane, Kidderminster DY11 7TA


| Today | See what it's worth now |
| 27 Nov 2025 | £410,000 |
| 27 Jul 2018 | £335,000 |
8, Bolas Avenue, Kidderminster DY11 7TX
| Today | See what it's worth now |
| 24 Nov 2025 | £460,000 |
| 27 Jan 2017 | £349,995 |
No other historical records.
Ashcroft, Quarry Bank, Kidderminster DY11 7TE
| Today | See what it's worth now |
| 20 Oct 2025 | £320,000 |
| 2 Jun 1997 | £100,000 |
No other historical records.
Oak Hurst, Old Worcester Road, Kidderminster DY11 7XS

| Today | See what it's worth now |
| 10 Sep 2025 | £258,000 |
| 19 Mar 2021 | £210,000 |
3, Meadow Cottages, Moors Avenue, Kidderminster DY11 7YL
| Today | See what it's worth now |
| 5 Sep 2025 | £225,000 |
| 30 Aug 2019 | £160,100 |
Colster, Waresley Road, Kidderminster DY11 7XT
| Today | See what it's worth now |
| 1 Sep 2025 | £409,750 |
| 1 Jun 2007 | £258,000 |
6, Walton Cottages, Walton Road, Kidderminster DY10 4JA

| Today | See what it's worth now |
| 1 Aug 2025 | £262,500 |
| 12 Dec 1997 | £68,500 |
No other historical records.
21, Waresley Court Road, Kidderminster DY11 7TQ
| Today | See what it's worth now |
| 22 Jul 2025 | £335,000 |
| 28 Sep 2012 | £178,300 |
No other historical records.
Storge Cottage, Old Forge Gardens, Hartlebury DY11 7TA
| Today | See what it's worth now |
| 11 Jul 2025 | £375,000 |
| 14 Feb 2001 | £137,500 |
58, Groves Way, Kidderminster DY11 7TU
| Today | See what it's worth now |
| 7 May 2025 | £435,000 |
| 1 Apr 2021 | £399,950 |
52, Waresley Park, Kidderminster DY11 7XE

| Today | See what it's worth now |
| 31 Mar 2025 | £393,500 |
| 6 Mar 2020 | £315,000 |
44, Groves Way, Kidderminster DY11 7TU
| Today | See what it's worth now |
| 28 Mar 2025 | £440,000 |
| 29 Sep 2017 | £355,000 |
No other historical records.
3, Morgan Mews, Old Worcester Road, Kidderminster DY11 7XH

| Today | See what it's worth now |
| 28 Mar 2025 | £305,000 |
| 11 Oct 2019 | £276,500 |
No other historical records.
28, Waresley Court Road, Kidderminster DY11 7TQ
| Today | See what it's worth now |
| 14 Mar 2025 | £418,000 |
| 6 Apr 2001 | £72,000 |
No other historical records.
Ryland Barn, Old Worcester Road, Hartlebury DY11 7XB

| Today | See what it's worth now |
| 28 Feb 2025 | £450,000 |
No other historical records.
High Tree, Waresley Road, Hartlebury DY11 7XT
| Today | See what it's worth now |
| 27 Feb 2025 | £285,000 |
No other historical records.
12, Whitley Close, Kidderminster DY11 7TY
| Today | See what it's worth now |
| 21 Feb 2025 | £593,000 |
| 2 Dec 2022 | £585,000 |
8, Council Houses, Old Worcester Road, Kidderminster DY11 7XB

| Today | See what it's worth now |
| 21 Feb 2025 | £278,000 |
| 26 Sep 2014 | £155,000 |
2, Parkfield Close, Kidderminster DY11 7TW

| Today | See what it's worth now |
| 26 Nov 2024 | £405,000 |
| 14 Oct 2014 | £247,000 |
6, Elmfield Road, Kidderminster DY11 7LA

| Today | See what it's worth now |
| 8 Nov 2024 | £530,000 |
| 29 Aug 1997 | £169,950 |
No other historical records.
2, Moors Villa, Moors Avenue, Hartlebury DY11 7YL
| Today | See what it's worth now |
| 20 Sep 2024 | £191,000 |
No other historical records.
Chaundy House, Quarry Bank, Kidderminster DY11 7TE

| Today | See what it's worth now |
| 17 Sep 2024 | £538,000 |
| 20 Oct 2006 | £275,000 |
No other historical records.
Source Acknowledgement: © Crown copyright. England and Wales house price data is publicly available information produced by the HM Land Registry.This material was last updated on 4 February 2026. It covers the period from 1 January 1995 to 24 December 2025 and contains property transactions which have been registered during that period. Contains HM Land Registry data © Crown copyright and database right 2026. This data is licensed under the Open Government Licence v3.0.
Disclaimer: Rightmove.co.uk provides this HM Land Registry data "as is". The burden for fitness of the data relies completely with the user and is provided for informational purposes only. No warranty, express or implied, is given relating to the accuracy of content of the HM Land Registry data and Rightmove does not accept any liability for error or omission. If you have found an error with the data or need further information please contact HM Land Registry.
Permitted Use: Viewers of this Information are granted permission to access this Crown copyright material and to download it onto electronic, magnetic, optical or similar storage media provided that such activities are for private research, study or in-house use only. Any other use of the material requires the formal written permission of Land Registry which can be requested from us, and is subject to an additional licence and associated charge.
Map data ©OpenStreetMap contributors.
Rightmove takes no liability for your use of, or reliance on, Rightmove's Instant Valuation due to the limitations of our tracking tool listed here. Use of this tool is taken entirely at your own risk. All rights reserved.