
House Prices in Hartshead
House prices in Hartshead have an overall average of £139,900 over the last year.
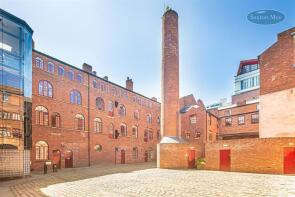
The majority of properties sold in Hartshead during the last year were flats, selling for an average price of £141,577. Detached properties sold for an average of £140,000, with terraced properties fetching £118,000.
Overall, the historical sold prices in Hartshead over the last year were 7% down on the previous year and 36% down on the 1998 peak of £217,500.
Properties Sold
Apartment 1, 31 Berona House, Charles Street, Sheffield S1 2HU
| Today | See what it's worth now |
| 19 Feb 2026 | £127,500 |
| 22 Mar 2019 | £138,000 |
Apartment 9 Butcher Works, 70, Arundel Street, Sheffield S1 2NS
| Today | See what it's worth now |
| 13 Jan 2026 | £196,500 |
| 31 Mar 2008 | £175,500 |
No other historical records.
Apartment 24 Butcher Works, 80, Arundel Street, Sheffield S1 2NS
| Today | See what it's worth now |
| 22 Dec 2025 | £117,000 |
| 31 Aug 2022 | £120,000 |
1, 11 15 Telegraph House, High Street, City Centre, Sheffield S1 2GA
| Today | See what it's worth now |
| 15 Dec 2025 | £100,000 |
| 24 Aug 2021 | £140,000 |
Apartment 53, 7 City Lofts St Paul's, St Paul's Square, Sheffield S1 2LB
| Today | See what it's worth now |
| 24 Nov 2025 | £151,000 |
| 1 Jul 2011 | £119,950 |
No other historical records.
Apartment 1, 14, Campo Lane, Sheffield S1 2EF
| Today | See what it's worth now |
| 20 Nov 2025 | £72,500 |
| 11 Feb 2005 | £105,000 |
No other historical records.
94, Campo Lane, Sheffield S1 2EG
| Today | See what it's worth now |
| 10 Nov 2025 | £140,000 |
No other historical records.
Apartment 235, 7 City Lofts St Paul's, St Paul's Square, Sheffield S1 2LL
| Today | See what it's worth now |
| 1 Nov 2025 | £160,000 |
| 2 May 2014 | £162,000 |
No other historical records.
Apartment 12, 4 Mazda Building, St Peter's Close, Sheffield S1 2EN
| Today | See what it's worth now |
| 31 Oct 2025 | £235,000 |
| 22 Feb 2022 | £205,000 |
Apartment 9, 4 Mazda Building, St Peter's Close, Sheffield S1 2EN
| Today | See what it's worth now |
| 10 Oct 2025 | £189,000 |
| 23 Mar 2021 | £170,000 |
Apartment 26 Butcher Works, 80, Arundel Street, Sheffield S1 2NS

| Today | See what it's worth now |
| 29 Sep 2025 | £107,000 |
| 26 Apr 2007 | £129,500 |
No other historical records.
Apartment 74, 105 Queens House, Queen Street, City Centre, Sheffield S1 1AE
| Today | See what it's worth now |
| 10 Sep 2025 | £140,000 |
| 10 Aug 2018 | £127,500 |
No other historical records.
Apartment 20 Butcher Works, 76, Arundel Street, Sheffield S1 2NS
| Today | See what it's worth now |
| 22 Aug 2025 | £120,000 |
| 26 Apr 2007 | £117,000 |
No other historical records.
73, Hawley Street, Sheffield S1 2EA
| Today | See what it's worth now |
| 31 Jul 2025 | £118,000 |
| 7 Jun 2022 | £118,000 |
Apartment 98, 105 Queens House, Queen Street, City Centre, Sheffield S1 1AE

| Today | See what it's worth now |
| 1 Jul 2025 | £125,000 |
| 6 Sep 2018 | £124,500 |
No other historical records.
49, 20 The Chimes, Vicar Lane, City Centre, Sheffield S1 2EH
| Today | See what it's worth now |
| 26 Jun 2025 | £168,000 |
| 17 Dec 2014 | £173,250 |
20, 55 Queens Buildings, Queen Street, City Centre, Sheffield S1 2DX
| Today | See what it's worth now |
| 20 Jun 2025 | £161,250 |
| 30 Sep 2021 | £157,000 |
Apartment 7, 7 City Lofts St Paul's, St Paul's Square, Sheffield S1 2LB
| Today | See what it's worth now |
| 2 May 2025 | £110,000 |
| 22 Jan 2013 | £105,000 |
No other historical records.
Apartment 108, 2 Pearl Works, Howard Lane, Sheffield S1 2FT
| Today | See what it's worth now |
| 11 Apr 2025 | £45,000 |
| 11 Aug 2022 | £64,000 |
Apartment 249, 7 City Lofts St Paul's, St Paul's Square, Sheffield S1 2LL
| Today | See what it's worth now |
| 11 Apr 2025 | £110,000 |
| 3 Nov 2014 | £129,200 |
Apartment 309, 7 City Lofts St Paul's, St Paul's Square, Sheffield S1 2LN
| Today | See what it's worth now |
| 9 Apr 2025 | £166,000 |
| 30 Jul 2012 | £205,000 |
No other historical records.
Apartment 14 Bow House, 17, Holly Street, Sheffield S1 2GT

| Today | See what it's worth now |
| 28 Mar 2025 | £110,000 |
| 25 Sep 2015 | £121,500 |
Apartment 39, 1 Ag1, Furnival Street, Sheffield S1 4QS
| Today | See what it's worth now |
| 28 Mar 2025 | £144,000 |
| 21 Dec 2006 | £148,300 |
No other historical records.
Source Acknowledgement: © Crown copyright. England and Wales house price data is publicly available information produced by the HM Land Registry.This material was last updated on 15 May 2026. It covers the period from 1 January 1995 to 31 March 2026 and contains property transactions which have been registered during that period. Contains HM Land Registry data © Crown copyright and database right 2026. This data is licensed under the Open Government Licence v3.0.
Disclaimer: Rightmove.co.uk provides this HM Land Registry data "as is". The burden for fitness of the data relies completely with the user and is provided for informational purposes only. No warranty, express or implied, is given relating to the accuracy of content of the HM Land Registry data and Rightmove does not accept any liability for error or omission. If you have found an error with the data or need further information please contact HM Land Registry.
Permitted Use: Viewers of this Information are granted permission to access this Crown copyright material and to download it onto electronic, magnetic, optical or similar storage media provided that such activities are for private research, study or in-house use only. Any other use of the material requires the formal written permission of Land Registry which can be requested from us, and is subject to an additional licence and associated charge.
Rightmove takes no liability for your use of, or reliance on, Rightmove's Instant Valuation due to the limitations of our tracking tool listed here. Use of this tool is taken entirely at your own risk. All rights reserved.