
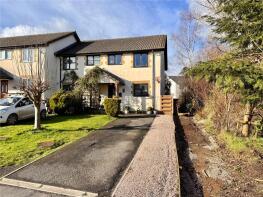
House Prices in Hatherleigh
House prices in Hatherleigh have an overall average of £251,000 over the last year.
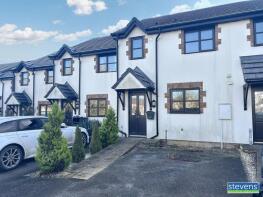
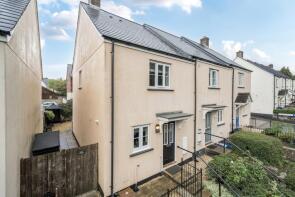
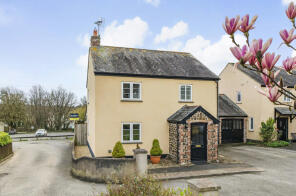
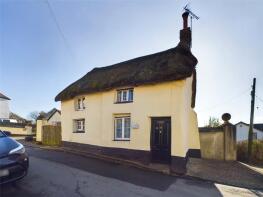
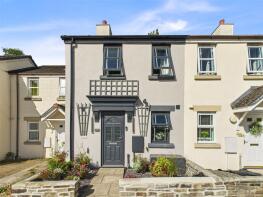
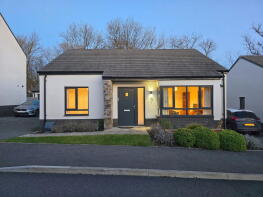
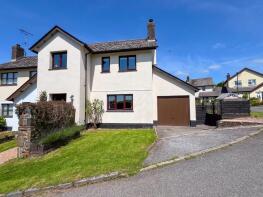
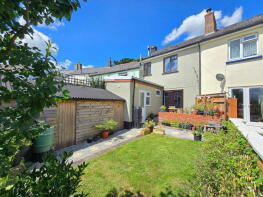
The majority of properties sold in Hatherleigh during the last year were terraced properties, selling for an average price of £236,812. Detached properties sold for an average of £286,786, with semi-detached properties fetching £227,500.
Overall, the historical sold prices in Hatherleigh over the last year were 11% down on the previous year and 9% down on the 2015 peak of £274,698.
Properties Sold
22, Pearse Close, Okehampton EX20 3QW
| Today | See what it's worth now |
| 15 Apr 2026 | £195,000 |
| 1 Nov 2005 | £127,000 |
24, Oakfield Road, Okehampton EX20 3JT
| Today | See what it's worth now |
| 30 Mar 2026 | £220,000 |
| 9 Oct 2015 | £153,000 |
3, Knights Court, Bridge Street, Okehampton EX20 3HA
| Today | See what it's worth now |
| 27 Mar 2026 | £345,000 |
| 2 Sep 2002 | £154,950 |
No other historical records.
18 Reed Cottage, Higher Street, Okehampton EX20 3JD
| Today | See what it's worth now |
| 26 Mar 2026 | £190,000 |
| 24 Oct 2008 | £187,000 |
6, Hooper Close, Okehampton EX20 3SN
| Today | See what it's worth now |
| 6 Feb 2026 | £330,000 |
| 9 Aug 2007 | £210,000 |
No other historical records.
4, South Street, Okehampton EX20 3JB
| Today | See what it's worth now |
| 16 Jan 2026 | £265,000 |
| 12 Oct 2007 | £240,000 |
50, Pearse Close, Okehampton EX20 3QW

| Today | See what it's worth now |
| 16 Dec 2025 | £185,000 |
| 29 Apr 2016 | £137,000 |
3, Pearse Close, Okehampton EX20 3QW
| Today | See what it's worth now |
| 16 Dec 2025 | £272,500 |
| 14 Dec 2021 | £250,000 |
4, Oldham Road, Okehampton EX20 3SL
| Today | See what it's worth now |
| 10 Dec 2025 | £213,000 |
| 12 Sep 2007 | £153,000 |
20, Vicks Meadow, Okehampton EX20 3DB
| Today | See what it's worth now |
| 28 Nov 2025 | £190,000 |
| 1 May 2009 | £135,000 |
No other historical records.
7, Alder View, Okehampton EX20 3FD
| Today | See what it's worth now |
| 26 Nov 2025 | £290,000 |
| 26 Nov 2025 | £290,000 |
2, Cob Meadow, Okehampton EX20 3JZ
| Today | See what it's worth now |
| 5 Nov 2025 | £266,000 |
| 25 Oct 2018 | £195,000 |
No other historical records.
8, Park Road, Okehampton EX20 3JS
| Today | See what it's worth now |
| 10 Oct 2025 | £228,500 |
| 3 Dec 2021 | £198,000 |
2, Reed Meadow, Okehampton EX20 3JL
| Today | See what it's worth now |
| 3 Oct 2025 | £242,000 |
| 27 Oct 2023 | £235,000 |
No other historical records.
1, Pound Meadow, Okehampton EX20 3JJ
| Today | See what it's worth now |
| 28 Aug 2025 | £345,000 |
| 4 Nov 1996 | £60,000 |
No other historical records.
15, Old Market Way, Okehampton EX20 3FB
| Today | See what it's worth now |
| 28 Aug 2025 | £290,000 |
| 30 Nov 2021 | £257,950 |
No other historical records.
2, The Manor Hall, Bridge Street, Okehampton EX20 3DD
| Today | See what it's worth now |
| 22 Aug 2025 | £161,000 |
| 10 Feb 2017 | £134,000 |
No other historical records.
4, Alder View, Okehampton EX20 3FD
| Today | See what it's worth now |
| 30 Jul 2025 | £305,000 |
| 28 Jul 2022 | £259,995 |
No other historical records.
55, Pearse Close, Okehampton EX20 3QW

| Today | See what it's worth now |
| 17 Jul 2025 | £172,000 |
| 29 Sep 1999 | £48,500 |
No other historical records.
Garden Cottage, Hatherleigh EX20 3JY
| Today | See what it's worth now |
| 7 Jul 2025 | £160,000 |
No other historical records.
40, Pearse Close, Okehampton EX20 3QW

| Today | See what it's worth now |
| 19 Jun 2025 | £370,000 |
| 7 Jul 2021 | £250,000 |
47, Pearse Close, Okehampton EX20 3QW
| Today | See what it's worth now |
| 6 Jun 2025 | £186,000 |
| 15 Sep 2023 | £152,000 |
11 Tiggywinkle Cottage, South Street, Okehampton EX20 3JB
| Today | See what it's worth now |
| 2 Jun 2025 | £256,000 |
| 28 Jan 2019 | £220,000 |
Source Acknowledgement: © Crown copyright. England and Wales house price data is publicly available information produced by the HM Land Registry.This material was last updated on 9 July 2026. It covers the period from 1 January 1995 to 30 April 2026 and contains property transactions which have been registered during that period. Contains HM Land Registry data © Crown copyright and database right 2026. This data is licensed under the Open Government Licence v3.0.
Disclaimer: Rightmove.co.uk provides this HM Land Registry data "as is". The burden for fitness of the data relies completely with the user and is provided for informational purposes only. No warranty, express or implied, is given relating to the accuracy of content of the HM Land Registry data and Rightmove does not accept any liability for error or omission. If you have found an error with the data or need further information please contact HM Land Registry.
Permitted Use: Viewers of this Information are granted permission to access this Crown copyright material and to download it onto electronic, magnetic, optical or similar storage media provided that such activities are for private research, study or in-house use only. Any other use of the material requires the formal written permission of Land Registry which can be requested from us, and is subject to an additional licence and associated charge.
Rightmove takes no liability for your use of, or reliance on, Rightmove's Instant Valuation due to the limitations of our tracking tool listed here. Use of this tool is taken entirely at your own risk. All rights reserved.