
House Prices in Hebburn
House prices in Hebburn have an overall average of £179,794 over the last year.
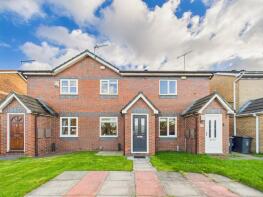
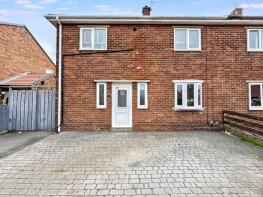
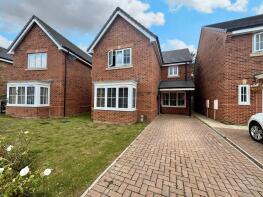
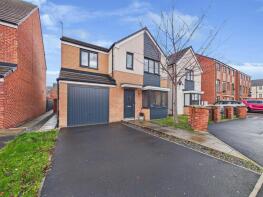
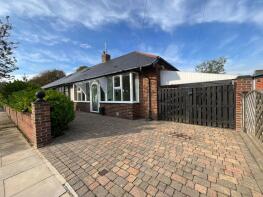
The majority of properties sold in Hebburn during the last year were semi-detached properties, selling for an average price of £186,871. Terraced properties sold for an average of £144,677, with detached properties fetching £298,538.
Overall, the historical sold prices in Hebburn over the last year were 3% down on the previous year and similar to the 2022 peak of £180,527.
Properties Sold
26, Tidespring Row, Hebburn NE31 1AS

| Today | See what it's worth now |
| 24 Apr 2026 | £113,000 |
| 5 Dec 2023 | £79,950 |
11, Ashwood Croft, Hebburn NE31 1BT
| Today | See what it's worth now |
| 16 Apr 2026 | £135,000 |
| 22 Sep 2016 | £92,000 |
102, Black Road, Hebburn NE31 1HQ
| Today | See what it's worth now |
| 9 Apr 2026 | £168,000 |
| 10 Dec 2021 | £143,000 |
No other historical records.
79, Holmes Drive, Hebburn NE31 2BE
| Today | See what it's worth now |
| 9 Apr 2026 | £325,000 |
| 23 Aug 2019 | £259,995 |
No other historical records.
101, Tennant Street, Hebburn NE31 1LN
| Today | See what it's worth now |
| 7 Apr 2026 | £120,000 |
| 24 Aug 2012 | £84,500 |
15, Monkton Hall, Hebburn NE31 2RH
| Today | See what it's worth now |
| 2 Apr 2026 | £130,000 |
| 26 Feb 2021 | £85,000 |
21, St Nicholas Way, Hebburn NE31 1RJ

| Today | See what it's worth now |
| 31 Mar 2026 | £330,000 |
| 28 Jun 2013 | £242,950 |
No other historical records.
27, Swift Grove, South Tyneside, Hebburn NE31 1FA

| Today | See what it's worth now |
| 27 Mar 2026 | £240,000 |
| 23 Sep 2022 | £192,000 |
96, Victoria Road West, Hebburn NE31 1LS
| Today | See what it's worth now |
| 23 Mar 2026 | £230,000 |
| 27 Jun 2025 | £238,500 |
No other historical records.
46, Chaffinch Drive, Hebburn NE31 1BF
| Today | See what it's worth now |
| 20 Mar 2026 | £193,000 |
| 18 Dec 2020 | £149,950 |
No other historical records.
37, Wellington Street, Hebburn NE31 2UQ
| Today | See what it's worth now |
| 20 Mar 2026 | £93,000 |
| 29 Oct 2020 | £78,000 |
45, Dahlia Way, Hebburn NE31 2QF
| Today | See what it's worth now |
| 20 Mar 2026 | £212,000 |
| 7 Sep 2012 | £165,000 |
30, Marina View, Hebburn NE31 1RX
| Today | See what it's worth now |
| 20 Mar 2026 | £175,000 |
No other historical records.
40, Northbourne Road, Jarrow NE32 5JS
| Today | See what it's worth now |
| 20 Mar 2026 | £82,000 |
| 21 Dec 2006 | £82,600 |
33, Landfall Drive, Hebburn NE31 1FE
| Today | See what it's worth now |
| 20 Mar 2026 | £290,000 |
| 15 Dec 2006 | £224,950 |
No other historical records.
116, Finchale Road, Hebburn NE31 2JS
| Today | See what it's worth now |
| 20 Mar 2026 | £148,000 |
| 25 Oct 2019 | £93,000 |
3, Douglass Close, Hebburn NE31 1AD

| Today | See what it's worth now |
| 18 Mar 2026 | £195,000 |
| 7 Dec 2023 | £170,000 |
17, Swift Grove, South Tyneside, Hebburn NE31 1FA
| Today | See what it's worth now |
| 16 Mar 2026 | £278,000 |
| 20 Dec 2019 | £224,950 |
No other historical records.
131, St Aloysius View, Hebburn NE31 1RH
| Today | See what it's worth now |
| 13 Mar 2026 | £266,000 |
| 30 Nov 2016 | £208,950 |
No other historical records.
47, Lambley Crescent, Hebburn NE31 2ND

| Today | See what it's worth now |
| 13 Mar 2026 | £168,000 |
| 2 Mar 1998 | £47,000 |
No other historical records.
47, Northbourne Road, Jarrow NE32 5JS

| Today | See what it's worth now |
| 13 Mar 2026 | £85,000 |
| 7 Jun 2023 | £71,000 |
9, Clennell Avenue, Hebburn NE31 2TW
| Today | See what it's worth now |
| 13 Mar 2026 | £230,000 |
| 15 Oct 2004 | £165,000 |
No other historical records.
10, Palmer Crescent, Hebburn NE31 2XZ
| Today | See what it's worth now |
| 13 Mar 2026 | £148,000 |
No other historical records.
Source Acknowledgement: © Crown copyright. England and Wales house price data is publicly available information produced by the HM Land Registry.This material was last updated on 9 July 2026. It covers the period from 1 January 1995 to 30 April 2026 and contains property transactions which have been registered during that period. Contains HM Land Registry data © Crown copyright and database right 2026. This data is licensed under the Open Government Licence v3.0.
Disclaimer: Rightmove.co.uk provides this HM Land Registry data "as is". The burden for fitness of the data relies completely with the user and is provided for informational purposes only. No warranty, express or implied, is given relating to the accuracy of content of the HM Land Registry data and Rightmove does not accept any liability for error or omission. If you have found an error with the data or need further information please contact HM Land Registry.
Permitted Use: Viewers of this Information are granted permission to access this Crown copyright material and to download it onto electronic, magnetic, optical or similar storage media provided that such activities are for private research, study or in-house use only. Any other use of the material requires the formal written permission of Land Registry which can be requested from us, and is subject to an additional licence and associated charge.
Rightmove takes no liability for your use of, or reliance on, Rightmove's Instant Valuation due to the limitations of our tracking tool listed here. Use of this tool is taken entirely at your own risk. All rights reserved.