
House Prices in Wallsend
House prices in Wallsend have an overall average of £167,188 over the last year.
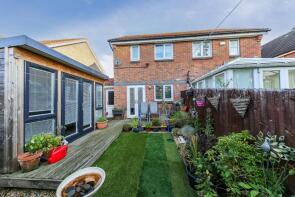
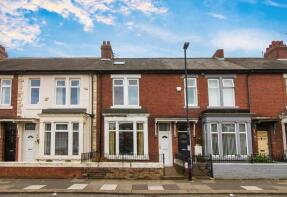
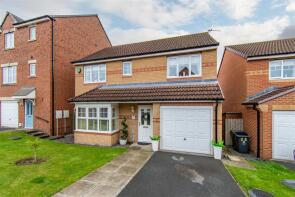
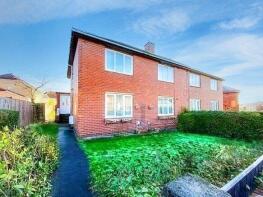
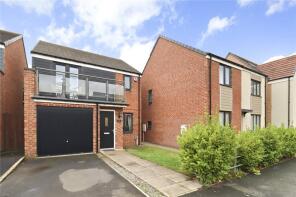
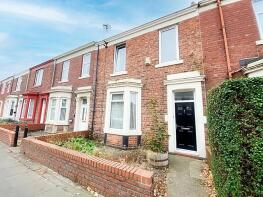
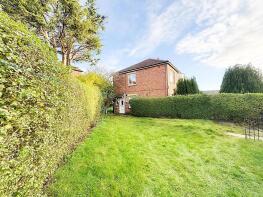
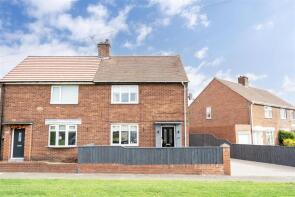
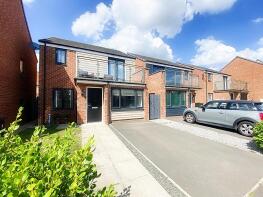
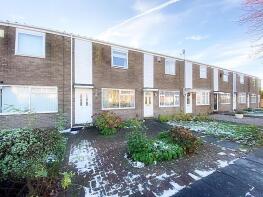
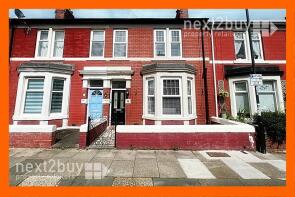
The majority of properties sold in Wallsend during the last year were terraced properties, selling for an average price of £150,192. Semi-detached properties sold for an average of £182,955, with flats fetching £85,092.
Overall, the historical sold prices in Wallsend over the last year were 3% down on the previous year and 2% up on the 2023 peak of £164,672.
Properties Sold
40, Cawfields Close, Wallsend NE28 0BJ
| Today | See what it's worth now |
| 24 Apr 2026 | £252,500 |
| 10 Nov 2022 | £246,000 |
32, Tiberius Close, Wallsend NE28 6RH
| Today | See what it's worth now |
| 22 Apr 2026 | £94,500 |
| 19 Dec 2023 | £91,000 |
17, Boston Close, Battle Hill, Wallsend NE28 9BN
| Today | See what it's worth now |
| 15 Apr 2026 | £195,000 |
| 20 Nov 2015 | £90,000 |
No other historical records.
29, Clavering Street, Wallsend NE28 6SW
| Today | See what it's worth now |
| 15 Apr 2026 | £164,000 |
No other historical records.
49, Queens Crescent, Wallsend NE28 8DW
| Today | See what it's worth now |
| 14 Apr 2026 | £120,000 |
| 7 Jun 2010 | £59,400 |
No other historical records.
14, Ashfield Mews, Wallsend NE28 7RG
| Today | See what it's worth now |
| 9 Apr 2026 | £95,000 |
| 27 Sep 2023 | £80,000 |
146, Richardson Street, Wallsend NE28 7PR
| Today | See what it's worth now |
| 8 Apr 2026 | £118,000 |
| 16 Jul 2003 | £37,000 |
16, Tree Top Mews, Wallsend NE28 9EH
| Today | See what it's worth now |
| 8 Apr 2026 | £80,000 |
| 3 Jun 2005 | £105,000 |
62, Moor Drive, Wallsend NE28 9FE

| Today | See what it's worth now |
| 7 Apr 2026 | £395,000 |
| 20 Dec 2019 | £294,950 |
No other historical records.
67, Hotspur Road, Sunholme Estate, Wallsend NE28 9HJ
| Today | See what it's worth now |
| 2 Apr 2026 | £177,500 |
No other historical records.
49, Tynedale Avenue, High Farm, Wallsend NE28 9LS

| Today | See what it's worth now |
| 2 Apr 2026 | £230,000 |
| 11 Apr 2022 | £184,000 |
42, Church View, Wallsend NE28 6PS
| Today | See what it's worth now |
| 27 Mar 2026 | £185,000 |
| 21 Jul 2017 | £129,450 |
13, North View, Wallsend NE28 7NF
| Today | See what it's worth now |
| 27 Mar 2026 | £188,000 |
| 9 Jun 2004 | £91,000 |
9, Benton Walk, Wallsend NE28 9GB
| Today | See what it's worth now |
| 27 Mar 2026 | £335,000 |
| 26 Jun 2023 | £309,950 |
No other historical records.
27, Cawfields Close, Wallsend NE28 0BJ
| Today | See what it's worth now |
| 27 Mar 2026 | £285,000 |
| 31 May 2012 | £210,000 |
No other historical records.
86, Lisle Grove, Howdon, Wallsend NE28 0LS
| Today | See what it's worth now |
| 27 Mar 2026 | £85,000 |
No other historical records.
6, Moor Drive, Wallsend NE28 9FE
| Today | See what it's worth now |
| 25 Mar 2026 | £236,000 |
| 9 Jun 2017 | £190,950 |
No other historical records.
65, Northumberland Terrace, Wallsend NE28 7BL
| Today | See what it's worth now |
| 24 Mar 2026 | £165,000 |
| 2 Jun 2006 | £132,500 |
No other historical records.
24, Redcar Road, Howdon, Wallsend NE28 0DD
| Today | See what it's worth now |
| 23 Mar 2026 | £90,225 |
| 30 Jul 2015 | £66,000 |
No other historical records.
33, Brampton Gardens, Howdon, Wallsend NE28 0HD
| Today | See what it's worth now |
| 20 Mar 2026 | £181,500 |
No other historical records.
17, Moor Drive, Wallsend NE28 9FE
| Today | See what it's worth now |
| 20 Mar 2026 | £245,000 |
| 12 Dec 2019 | £214,000 |
25, Catton Place, Hadrian Park, Wallsend NE28 9UG
| Today | See what it's worth now |
| 20 Mar 2026 | £145,000 |
| 17 Mar 2023 | £130,000 |
76, Laburnum Avenue, Wallsend NE28 8HG
| Today | See what it's worth now |
| 20 Mar 2026 | £190,000 |
| 2 Aug 2021 | £162,000 |
No other historical records.
Source Acknowledgement: © Crown copyright. England and Wales house price data is publicly available information produced by the HM Land Registry.This material was last updated on 9 July 2026. It covers the period from 1 January 1995 to 30 April 2026 and contains property transactions which have been registered during that period. Contains HM Land Registry data © Crown copyright and database right 2026. This data is licensed under the Open Government Licence v3.0.
Disclaimer: Rightmove.co.uk provides this HM Land Registry data "as is". The burden for fitness of the data relies completely with the user and is provided for informational purposes only. No warranty, express or implied, is given relating to the accuracy of content of the HM Land Registry data and Rightmove does not accept any liability for error or omission. If you have found an error with the data or need further information please contact HM Land Registry.
Permitted Use: Viewers of this Information are granted permission to access this Crown copyright material and to download it onto electronic, magnetic, optical or similar storage media provided that such activities are for private research, study or in-house use only. Any other use of the material requires the formal written permission of Land Registry which can be requested from us, and is subject to an additional licence and associated charge.
Rightmove takes no liability for your use of, or reliance on, Rightmove's Instant Valuation due to the limitations of our tracking tool listed here. Use of this tool is taken entirely at your own risk. All rights reserved.