
House Prices in High Rougham
House prices in High Rougham have an overall average of £369,130 over the last year.
The majority of properties sold in High Rougham during the last year were detached properties, selling for an average price of £480,846. Semi-detached properties sold for an average of £254,881, with terraced properties fetching £238,988.
Overall, the historical sold prices in High Rougham over the last year were 8% down on the previous year and 8% down on the 2023 peak of £400,992.
Properties Sold
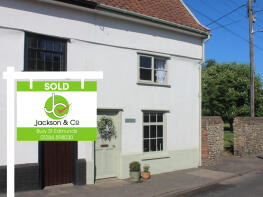
113, Hall Lane, Bury St. Edmunds IP30 9JH
| Today | See what it's worth now |
| 20 Mar 2026 | £262,000 |
| 12 Sep 2019 | £264,995 |
No other historical records.
3, Reed Place, Moat Lane, Bury St. Edmunds IP30 9LB
| Today | See what it's worth now |
| 17 Mar 2026 | £200,000 |
| 3 May 2019 | £205,000 |
No other historical records.
42, Wrights Way, Bury St. Edmunds IP30 9TY
| Today | See what it's worth now |
| 12 Mar 2026 | £173,000 |
| 26 Apr 2013 | £115,500 |
Charity Cottage, Nether Street, Bury St. Edmunds IP30 9LW
| Today | See what it's worth now |
| 11 Mar 2026 | £820,000 |
| 24 Aug 2023 | £740,000 |
37, Bennett Avenue, Bury St. Edmunds IP30 9UA
| Today | See what it's worth now |
| 6 Mar 2026 | £220,000 |
| 17 Apr 2009 | £131,000 |
61, St Edmunds Drive, Bury St. Edmunds IP30 9NP
| Today | See what it's worth now |
| 6 Mar 2026 | £468,000 |
| 17 Jul 2020 | £402,500 |
No other historical records.
32, Thedwastre Close, Bury St. Edmunds IP30 9DA
| Today | See what it's worth now |
| 26 Feb 2026 | £262,000 |
| 16 Feb 2017 | £180,000 |
11, White House Barns, Ashfield Road, Bury St. Edmunds IP30 9GY
| Today | See what it's worth now |
| 26 Feb 2026 | £168,000 |
| 7 May 2014 | £173,000 |
40, Wrights Way, Bury St. Edmunds IP30 9TY
| Today | See what it's worth now |
| 25 Feb 2026 | £172,000 |
| 19 Dec 2018 | £165,000 |
56, Bennett Avenue, Bury St. Edmunds IP30 9EX
| Today | See what it's worth now |
| 20 Feb 2026 | £207,000 |
| 19 May 2017 | £170,000 |
Birchfield, Church Road, Bury St. Edmunds IP30 9DU
| Today | See what it's worth now |
| 16 Feb 2026 | £622,500 |
| 27 Apr 2012 | £288,576 |
No other historical records.
26, William Armstrong Close, Bury St. Edmunds IP30 9UB
| Today | See what it's worth now |
| 11 Feb 2026 | £210,000 |
| 26 Jul 2021 | £220,000 |
6, Hawk End Lane, Bury St. Edmunds IP30 9ED
| Today | See what it's worth now |
| 6 Feb 2026 | £340,000 |
| 25 Sep 2009 | £147,500 |
8, Oxer Close, Bury St. Edmunds IP30 9UE
| Today | See what it's worth now |
| 30 Jan 2026 | £380,000 |
| 27 Feb 2009 | £175,000 |
15, Orchard Close, Bury St. Edmunds IP30 9UJ
| Today | See what it's worth now |
| 30 Jan 2026 | £250,000 |
| 24 Jun 2020 | £232,500 |
2, Green Close, Bury St. Edmunds IP30 9TE
| Today | See what it's worth now |
| 19 Dec 2025 | £470,000 |
| 23 Mar 2012 | £235,000 |
39, Hall Lane, Bury St. Edmunds IP30 9JH
| Today | See what it's worth now |
| 19 Dec 2025 | £270,000 |
| 29 Jun 2018 | £264,995 |
No other historical records.
27, Oxer Close, Bury St. Edmunds IP30 9UE
| Today | See what it's worth now |
| 19 Dec 2025 | £242,000 |
| 30 Oct 2020 | £220,000 |
1 Dorket House, Oaklands, Heath Road, Bury St. Edmunds IP30 9QF
| Today | See what it's worth now |
| 19 Dec 2025 | £440,000 |
| 21 Nov 2003 | £238,500 |
8, William Armstrong Close, Elmswell IP30 9UB
| Today | See what it's worth now |
| 19 Dec 2025 | £265,000 |
| 31 Jul 2025 | £193,000 |
No other historical records.
Magellan House, The Street, Bury St. Edmunds IP30 9SA
| Today | See what it's worth now |
| 17 Dec 2025 | £350,000 |
| 28 Jan 2022 | £320,000 |
Gable End, Leys Road, Bury St. Edmunds IP30 9PN
| Today | See what it's worth now |
| 17 Dec 2025 | £785,000 |
| 24 Mar 2023 | £820,000 |
15, Bakers Mill, Bury St. Edmunds IP30 9HU
| Today | See what it's worth now |
| 15 Dec 2025 | £236,250 |
| 2 Nov 2007 | £161,500 |
Source Acknowledgement: © Crown copyright. England and Wales house price data is publicly available information produced by the HM Land Registry.This material was last updated on 15 May 2026. It covers the period from 1 January 1995 to 31 March 2026 and contains property transactions which have been registered during that period. Contains HM Land Registry data © Crown copyright and database right 2026. This data is licensed under the Open Government Licence v3.0.
Disclaimer: Rightmove.co.uk provides this HM Land Registry data "as is". The burden for fitness of the data relies completely with the user and is provided for informational purposes only. No warranty, express or implied, is given relating to the accuracy of content of the HM Land Registry data and Rightmove does not accept any liability for error or omission. If you have found an error with the data or need further information please contact HM Land Registry.
Permitted Use: Viewers of this Information are granted permission to access this Crown copyright material and to download it onto electronic, magnetic, optical or similar storage media provided that such activities are for private research, study or in-house use only. Any other use of the material requires the formal written permission of Land Registry which can be requested from us, and is subject to an additional licence and associated charge.
Map data ©OpenStreetMap contributors.
Rightmove takes no liability for your use of, or reliance on, Rightmove's Instant Valuation due to the limitations of our tracking tool listed here. Use of this tool is taken entirely at your own risk. All rights reserved.