
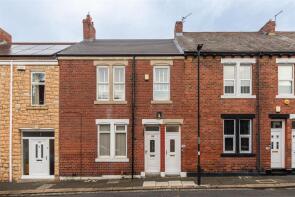
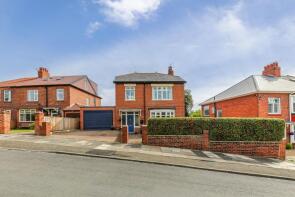
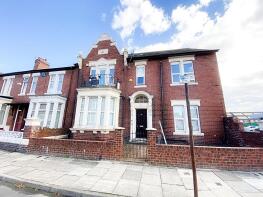
House Prices in Holy Cross
House prices in Holy Cross have an overall average of £157,795 over the last year.
The majority of properties sold in Holy Cross during the last year were terraced properties, selling for an average price of £148,320. Semi-detached properties sold for an average of £186,322, with flats fetching £84,614.
Overall, the historical sold prices in Holy Cross over the last year were 10% up on the previous year and 9% up on the 2023 peak of £144,788.
Properties Sold
146, Richardson Street, Wallsend NE28 7PR
| Today | See what it's worth now |
| 8 Apr 2026 | £118,000 |
| 16 Jul 2003 | £37,000 |
13, North View, Wallsend NE28 7NF
| Today | See what it's worth now |
| 27 Mar 2026 | £188,000 |
| 9 Jun 2004 | £91,000 |
65, Northumberland Terrace, Wallsend NE28 7BL
| Today | See what it's worth now |
| 24 Mar 2026 | £165,000 |
| 2 Jun 2006 | £132,500 |
No other historical records.
29, Ferndale Avenue, Wallsend NE28 7NE

| Today | See what it's worth now |
| 9 Mar 2026 | £163,000 |
| 28 Aug 2009 | £115,000 |
No other historical records.
20, Ashfield Mews, Wallsend NE28 7RG
| Today | See what it's worth now |
| 27 Feb 2026 | £190,550 |
| 28 Jun 2021 | £172,000 |
74, Willington Terrace, Rosehill, Wallsend NE28 7AQ
| Today | See what it's worth now |
| 26 Feb 2026 | £129,087 |
| 9 Oct 2009 | £57,000 |
No other historical records.
93-95a, Park Road, Wallsend NE28 7LP
| Today | See what it's worth now |
| 26 Feb 2026 | £207,500 |
No other historical records.
61, Boyd Road, Wallsend NE28 7SA
| Today | See what it's worth now |
| 25 Feb 2026 | £87,750 |
| 31 Jan 2014 | £70,000 |
39, Caesar Way, Wallsend NE28 7JL

| Today | See what it's worth now |
| 24 Feb 2026 | £228,000 |
| 8 May 2009 | £142,000 |
166, Park Road, Wallsend NE28 7QS
| Today | See what it's worth now |
| 16 Feb 2026 | £155,810 |
| 1 Aug 2007 | £133,000 |
20, Bede Crescent, Holy Cross, Wallsend NE28 7JG
| Today | See what it's worth now |
| 13 Feb 2026 | £175,000 |
| 27 Oct 2010 | £99,950 |
No other historical records.
148, High Street East, Wallsend NE28 7RP
| Today | See what it's worth now |
| 30 Jan 2026 | £42,500 |
No other historical records.
20, Chester Avenue, Rosehill, Wallsend NE28 7BE
| Today | See what it's worth now |
| 30 Jan 2026 | £157,000 |
No other historical records.
128, Savory Road, Wallsend NE28 7EH
| Today | See what it's worth now |
| 23 Jan 2026 | £162,000 |
No other historical records.
98, Bede Crescent, Holy Cross, Wallsend NE28 7HL
| Today | See what it's worth now |
| 13 Jan 2026 | £115,000 |
No other historical records.
6 Stromness, Irwin Avenue, Wallsend NE28 7QX
| Today | See what it's worth now |
| 19 Dec 2025 | £425,000 |
| 11 Sep 1998 | £96,000 |
No other historical records.
35, Caesar Way, Wallsend NE28 7JL
| Today | See what it's worth now |
| 19 Dec 2025 | £150,000 |
| 16 Dec 2003 | £118,000 |
30, Simonside Avenue, Wallsend NE28 7EG
| Today | See what it's worth now |
| 16 Dec 2025 | £130,000 |
| 25 Jan 2019 | £103,500 |
18, Grey Street, Wallsend NE28 7SE
| Today | See what it's worth now |
| 10 Dec 2025 | £80,000 |
| 21 Aug 2025 | £88,000 |
20, Grey Street, Wallsend NE28 7SE
| Today | See what it's worth now |
| 10 Dec 2025 | £80,000 |
| 23 Feb 2001 | £21,000 |
No other historical records.
4, Hornsby Court, Wallsend NE28 7AF
| Today | See what it's worth now |
| 5 Dec 2025 | £90,000 |
| 11 Jun 2009 | £65,000 |
No other historical records.
43, Dene Crescent, Wallsend NE28 7SN
| Today | See what it's worth now |
| 28 Nov 2025 | £165,500 |
No other historical records.
71, Richardson Street, Wallsend NE28 7PR
| Today | See what it's worth now |
| 28 Nov 2025 | £178,000 |
| 18 Dec 2015 | £118,500 |
Source Acknowledgement: © Crown copyright. England and Wales house price data is publicly available information produced by the HM Land Registry.This material was last updated on 9 July 2026. It covers the period from 1 January 1995 to 30 April 2026 and contains property transactions which have been registered during that period. Contains HM Land Registry data © Crown copyright and database right 2026. This data is licensed under the Open Government Licence v3.0.
Disclaimer: Rightmove.co.uk provides this HM Land Registry data "as is". The burden for fitness of the data relies completely with the user and is provided for informational purposes only. No warranty, express or implied, is given relating to the accuracy of content of the HM Land Registry data and Rightmove does not accept any liability for error or omission. If you have found an error with the data or need further information please contact HM Land Registry.
Permitted Use: Viewers of this Information are granted permission to access this Crown copyright material and to download it onto electronic, magnetic, optical or similar storage media provided that such activities are for private research, study or in-house use only. Any other use of the material requires the formal written permission of Land Registry which can be requested from us, and is subject to an additional licence and associated charge.
Rightmove takes no liability for your use of, or reliance on, Rightmove's Instant Valuation due to the limitations of our tracking tool listed here. Use of this tool is taken entirely at your own risk. All rights reserved.