
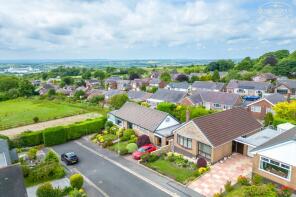
House Prices in Horwich
House prices in Horwich have an overall average of £248,500 over the last year.
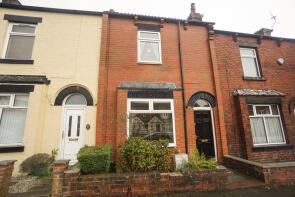
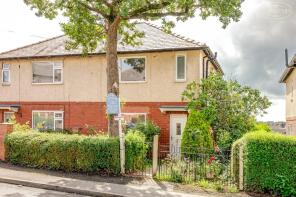
The majority of properties sold in Horwich during the last year were terraced properties, selling for an average price of £171,740. Semi-detached properties sold for an average of £239,678, with detached properties fetching £395,259.
Overall, the historical sold prices in Horwich over the last year were similar to the previous year and 10% up on the 2023 peak of £224,981.
Properties Sold
61, Longworth Road, Horwich, Bolton BL6 7BL
| Today | See what it's worth now |
| 24 Apr 2026 | £200,000 |
| 21 Oct 2009 | £110,000 |
No other historical records.
9, Old Lane, Horwich, Bolton BL6 6QL

| Today | See what it's worth now |
| 15 Apr 2026 | £225,000 |
| 11 Sep 2002 | £115,000 |
18, Armstrong Street, Horwich, Bolton BL6 5PW
| Today | See what it's worth now |
| 10 Apr 2026 | £135,500 |
| 8 Sep 2006 | £84,000 |
22, Mallard Drive, Horwich, Bolton BL6 5RN
| Today | See what it's worth now |
| 30 Mar 2026 | £295,000 |
No other historical records.
38, Hilton Avenue, Horwich, Bolton BL6 5RJ
| Today | See what it's worth now |
| 30 Mar 2026 | £190,000 |
| 26 Jun 2015 | £120,000 |
4, Moor Platt Close, Horwich, Bolton BL6 6QJ
| Today | See what it's worth now |
| 27 Mar 2026 | £280,000 |
No other historical records.
8, Panton Street, Horwich, Bolton BL6 6EE
| Today | See what it's worth now |
| 27 Mar 2026 | £145,000 |
| 29 Sep 2005 | £85,000 |
3, Croxton Walk, Horwich, Bolton BL6 7TJ

| Today | See what it's worth now |
| 23 Mar 2026 | £116,000 |
| 22 Dec 2011 | £55,000 |
133, Church Street, Horwich, Bolton BL6 7BR

| Today | See what it's worth now |
| 19 Mar 2026 | £200,000 |
No other historical records.
7, Matlock Court, Horwich, Bolton BL6 6TQ
| Today | See what it's worth now |
| 18 Mar 2026 | £140,000 |
| 2 Jul 2012 | £250,000 |
31, Berne Avenue, Horwich, Bolton BL6 7QZ
| Today | See what it's worth now |
| 18 Mar 2026 | £193,000 |
| 12 Jul 2024 | £165,000 |
16, Summer Street, Horwich, Bolton BL6 7PF
| Today | See what it's worth now |
| 16 Mar 2026 | £177,000 |
| 29 Nov 1996 | £38,000 |
No other historical records.
5, Tower Buildings, Chorley Old Road, Horwich, Bolton BL6 6PX
| Today | See what it's worth now |
| 9 Mar 2026 | £233,000 |
| 1 Jun 2023 | £200,000 |
73, Welders Drive, Horwich, Bolton BL6 5WR
| Today | See what it's worth now |
| 6 Mar 2026 | £248,000 |
No other historical records.
31, College Drive, Horwich, Bolton BL6 6GH
| Today | See what it's worth now |
| 6 Mar 2026 | £310,000 |
| 30 Sep 2020 | £253,950 |
No other historical records.
6, Lower Makinson Fold, Horwich, Bolton BL6 6PD
| Today | See what it's worth now |
| 27 Feb 2026 | £230,000 |
| 29 Sep 1995 | £66,750 |
No other historical records.
41, Ainsworth Avenue, Horwich, Bolton BL6 6NL
| Today | See what it's worth now |
| 27 Feb 2026 | £180,000 |
| 20 May 2005 | £91,000 |
No other historical records.
8, Ridgmont Close, Horwich, Bolton BL6 6RG

| Today | See what it's worth now |
| 27 Feb 2026 | £525,000 |
| 13 Oct 2022 | £435,000 |
67, Alexandra Road, Lostock, Bolton BL6 4BH

| Today | See what it's worth now |
| 27 Feb 2026 | £355,000 |
| 23 May 2008 | £172,000 |
No other historical records.
114, Lancashire Way, Horwich, Bolton BL6 5WH
| Today | See what it's worth now |
| 27 Feb 2026 | £340,000 |
| 19 Feb 2021 | £280,995 |
No other historical records.
43, Mottram Street, Horwich, Bolton BL6 7TU
| Today | See what it's worth now |
| 27 Feb 2026 | £68,250 |
| 21 Dec 2017 | £52,482 |
No other historical records.
26, Cooper Street, Horwich, Bolton BL6 7AT
| Today | See what it's worth now |
| 27 Feb 2026 | £173,500 |
| 19 Dec 2006 | £125,000 |
No other historical records.
9, St Annes Road, Horwich, Bolton BL6 7EJ
| Today | See what it's worth now |
| 27 Feb 2026 | £210,000 |
| 30 Sep 2021 | £170,000 |
Source Acknowledgement: © Crown copyright. England and Wales house price data is publicly available information produced by the HM Land Registry.This material was last updated on 9 July 2026. It covers the period from 1 January 1995 to 30 April 2026 and contains property transactions which have been registered during that period. Contains HM Land Registry data © Crown copyright and database right 2026. This data is licensed under the Open Government Licence v3.0.
Disclaimer: Rightmove.co.uk provides this HM Land Registry data "as is". The burden for fitness of the data relies completely with the user and is provided for informational purposes only. No warranty, express or implied, is given relating to the accuracy of content of the HM Land Registry data and Rightmove does not accept any liability for error or omission. If you have found an error with the data or need further information please contact HM Land Registry.
Permitted Use: Viewers of this Information are granted permission to access this Crown copyright material and to download it onto electronic, magnetic, optical or similar storage media provided that such activities are for private research, study or in-house use only. Any other use of the material requires the formal written permission of Land Registry which can be requested from us, and is subject to an additional licence and associated charge.
Rightmove takes no liability for your use of, or reliance on, Rightmove's Instant Valuation due to the limitations of our tracking tool listed here. Use of this tool is taken entirely at your own risk. All rights reserved.