
House Prices in Hunger Hill
House prices in Hunger Hill have an overall average of £236,842 over the last year.
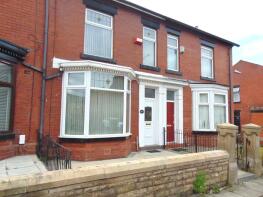
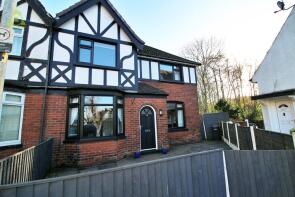
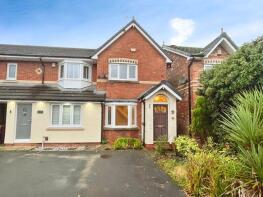
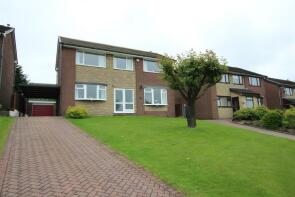
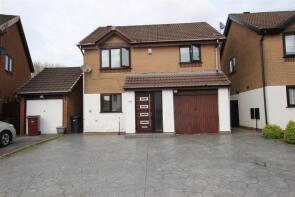
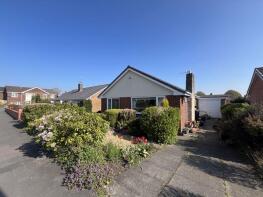
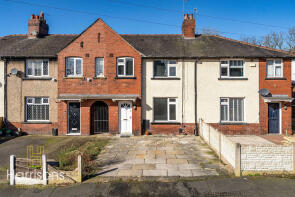
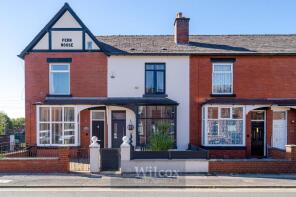
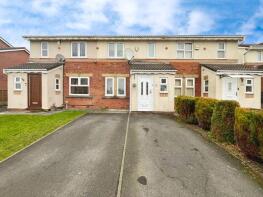
The majority of properties sold in Hunger Hill during the last year were detached properties, selling for an average price of £321,800. Terraced properties sold for an average of £168,300, with semi-detached properties fetching £211,105.
Overall, the historical sold prices in Hunger Hill over the last year were 8% up on the previous year and 23% up on the 2023 peak of £192,949.
Properties Sold
45, Oldstead Grove, Bolton BL3 4XW
| Today | See what it's worth now |
| 23 Apr 2026 | £300,000 |
| 14 Dec 2018 | £210,000 |
41, Beaumont Chase, Bolton BL3 4XH
| Today | See what it's worth now |
| 9 Apr 2026 | £165,000 |
| 30 Mar 2007 | £129,500 |
24, Knutshaw Crescent, Bolton BL3 4SB
| Today | See what it's worth now |
| 1 Apr 2026 | £178,000 |
| 16 May 2014 | £77,000 |
10, Amberley Close, Bolton BL3 4NJ
| Today | See what it's worth now |
| 23 Mar 2026 | £112,691 |
| 10 Nov 2023 | £390,000 |
No other historical records.
27, Stonehaven, Bolton BL3 4UW
| Today | See what it's worth now |
| 6 Mar 2026 | £185,000 |
| 15 Nov 2019 | £130,000 |
261, Deane Church Lane, Bolton BL3 4EW
| Today | See what it's worth now |
| 6 Mar 2026 | £245,000 |
| 12 Nov 2015 | £100,000 |
18, Hunger Hill Avenue, Bolton BL3 4SD
| Today | See what it's worth now |
| 6 Mar 2026 | £217,500 |
No other historical records.
41, Eastwood Close, Bolton BL3 4TG
| Today | See what it's worth now |
| 3 Mar 2026 | £160,000 |
| 26 Apr 2002 | £68,950 |
13, Tempest Street, Bolton BL3 4HR
| Today | See what it's worth now |
| 27 Feb 2026 | £110,100 |
| 22 Oct 1998 | £45,000 |
16, Blairmore Drive, Bolton BL3 4UE
| Today | See what it's worth now |
| 20 Feb 2026 | £375,000 |
No other historical records.
21, Baysdale Avenue, Bolton BL3 4XP
| Today | See what it's worth now |
| 20 Feb 2026 | £325,000 |
| 14 Aug 2015 | £150,000 |
44, The Walkway, Bolton BL3 4NT

| Today | See what it's worth now |
| 19 Feb 2026 | £242,000 |
| 28 May 1999 | £62,500 |
No other historical records.
3, Glenluce Walk, Bolton BL3 4XE
| Today | See what it's worth now |
| 13 Feb 2026 | £182,500 |
| 11 Jun 2021 | £155,000 |
489, Wigan Road, Bolton BL3 4QN
| Today | See what it's worth now |
| 30 Jan 2026 | £182,000 |
| 6 Jun 2002 | £25,000 |
No other historical records.
6, Bransdale Close, Bolton BL3 4XN
| Today | See what it's worth now |
| 30 Jan 2026 | £275,000 |
| 18 Mar 2014 | £144,000 |
No other historical records.
94, Beaumont Chase, Bolton BL3 4XH
| Today | See what it's worth now |
| 30 Jan 2026 | £188,000 |
| 4 Mar 2022 | £165,000 |
17, Beaumont Drive, Bolton BL3 4PJ
| Today | See what it's worth now |
| 23 Jan 2026 | £265,000 |
| 25 Oct 2004 | £170,000 |
No other historical records.
14, Knutshaw Crescent, Bolton BL3 4SB
| Today | See what it's worth now |
| 9 Jan 2026 | £133,000 |
| 6 Oct 2017 | £105,000 |
No other historical records.
7, Lennox Gardens, Bolton BL3 4NH

| Today | See what it's worth now |
| 6 Jan 2026 | £360,000 |
| 18 Dec 2020 | £245,000 |
No other historical records.
231, Deane Church Lane, Bolton BL3 4EW
| Today | See what it's worth now |
| 19 Dec 2025 | £200,000 |
| 25 May 2001 | £37,500 |
No other historical records.
49, Cranberry Drive, Bolton BL3 4TB
| Today | See what it's worth now |
| 18 Dec 2025 | £220,000 |
| 26 Sep 2005 | £132,000 |
12, Hornby Drive, Bolton BL3 4RP
| Today | See what it's worth now |
| 18 Dec 2025 | £180,000 |
| 30 Nov 2018 | £99,000 |
No other historical records.
29, Harbury Close, Bolton BL3 4JY
| Today | See what it's worth now |
| 12 Dec 2025 | £265,000 |
| 19 Jun 2015 | £122,000 |

Source Acknowledgement: © Crown copyright. England and Wales house price data is publicly available information produced by the HM Land Registry.This material was last updated on 9 July 2026. It covers the period from 1 January 1995 to 30 April 2026 and contains property transactions which have been registered during that period. Contains HM Land Registry data © Crown copyright and database right 2026. This data is licensed under the Open Government Licence v3.0.
Disclaimer: Rightmove.co.uk provides this HM Land Registry data "as is". The burden for fitness of the data relies completely with the user and is provided for informational purposes only. No warranty, express or implied, is given relating to the accuracy of content of the HM Land Registry data and Rightmove does not accept any liability for error or omission. If you have found an error with the data or need further information please contact HM Land Registry.
Permitted Use: Viewers of this Information are granted permission to access this Crown copyright material and to download it onto electronic, magnetic, optical or similar storage media provided that such activities are for private research, study or in-house use only. Any other use of the material requires the formal written permission of Land Registry which can be requested from us, and is subject to an additional licence and associated charge.
Rightmove takes no liability for your use of, or reliance on, Rightmove's Instant Valuation due to the limitations of our tracking tool listed here. Use of this tool is taken entirely at your own risk. All rights reserved.