
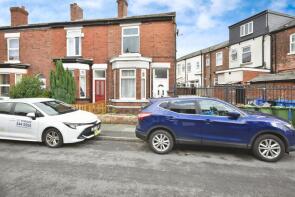
House Prices in Hyde
House prices in Hyde have an overall average of £245,705 over the last year.
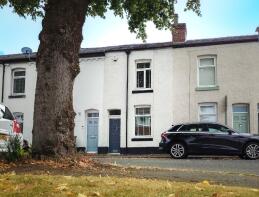
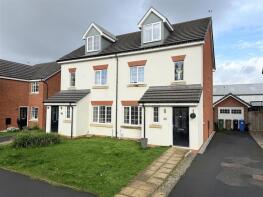
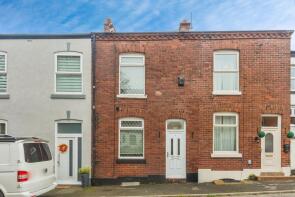
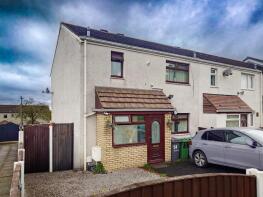
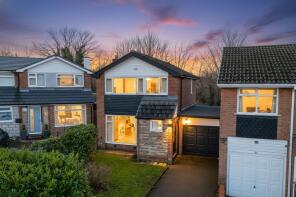
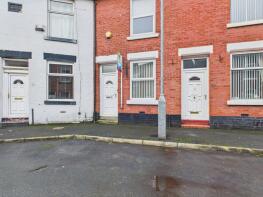
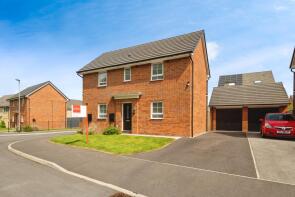
The majority of properties sold in Hyde during the last year were terraced properties, selling for an average price of £212,192. Semi-detached properties sold for an average of £254,794, with detached properties fetching £389,955.
Overall, the historical sold prices in Hyde over the last year were similar to the previous year and 12% up on the 2022 peak of £219,056.
Properties Sold
35, Lodge Lane, Hyde SK14 4JU

| Today | See what it's worth now |
| 17 Apr 2026 | £142,000 |
| 17 Apr 2000 | £35,000 |
No other historical records.
19, Higher Henry Street, Hyde SK14 1JP
| Today | See what it's worth now |
| 17 Apr 2026 | £125,000 |
| 11 Mar 2011 | £65,000 |
No other historical records.
8, Townend Street, Hyde SK14 1PT
| Today | See what it's worth now |
| 10 Apr 2026 | £130,000 |
| 1 Jun 2007 | £102,000 |
3, St Annes Street, Hyde SK14 6AL
| Today | See what it's worth now |
| 10 Apr 2026 | £210,000 |
| 30 Sep 2005 | £118,000 |
27, Cambourne Road, Mottram SK14 3DL
| Today | See what it's worth now |
| 9 Apr 2026 | £146,750 |
No other historical records.
23, Kensington Street, Hyde SK14 5QD
| Today | See what it's worth now |
| 2 Apr 2026 | £201,000 |
| 19 Aug 2002 | £55,000 |
29, Corporal Harvey Holmes Way, Hyde SK14 4XL
| Today | See what it's worth now |
| 2 Apr 2026 | £315,000 |
| 8 Nov 2018 | £236,950 |
No other historical records.
4, Andrew Street, Hyde SK14 2PA
| Today | See what it's worth now |
| 2 Apr 2026 | £148,000 |
| 2 Mar 2015 | £98,750 |
9, Godley Street, Hyde SK14 4AN

| Today | See what it's worth now |
| 2 Apr 2026 | £220,000 |
| 19 Oct 2007 | £12,000 |
367, Stockport Road, Hyde SK14 5RU
| Today | See what it's worth now |
| 2 Apr 2026 | £185,000 |
| 26 Oct 2018 | £131,000 |
44, Grosvenor Road, Hyde SK14 5AB
| Today | See what it's worth now |
| 31 Mar 2026 | £190,000 |
No other historical records.
2, Longlands Drive, Hyde SK14 3AX
| Today | See what it's worth now |
| 31 Mar 2026 | £350,000 |
| 4 May 2021 | £287,250 |
15, Repton Avenue, Hyde SK14 2LG
| Today | See what it's worth now |
| 27 Mar 2026 | £205,000 |
| 8 Jul 2022 | £145,000 |
No other historical records.
50, Ashworth Lane, Hyde SK14 6NU
| Today | See what it's worth now |
| 27 Mar 2026 | £190,000 |
| 2 Aug 2024 | £175,000 |
32, Sgt Mark Stansfield Way, Hyde SK14 3FX
| Today | See what it's worth now |
| 27 Mar 2026 | £410,000 |
| 29 Nov 2019 | £194,995 |
No other historical records.
54, Melandra Crescent, Hyde SK14 3RB
| Today | See what it's worth now |
| 27 Mar 2026 | £200,000 |
| 19 Feb 2016 | £83,000 |
No other historical records.
31, St Giles Drive, Hyde SK14 2ST
| Today | See what it's worth now |
| 27 Mar 2026 | £278,650 |
| 24 Nov 2003 | £70,000 |
No other historical records.
17, Martin Street, Hyde SK14 1NZ
| Today | See what it's worth now |
| 27 Mar 2026 | £200,000 |
| 1 Nov 2002 | £46,950 |
3, Carr Lane, Hyde SK14 3GQ
| Today | See what it's worth now |
| 26 Mar 2026 | £290,000 |
| 18 Dec 2020 | £177,995 |
No other historical records.
3, Arnold Road, Hyde SK14 5LH
| Today | See what it's worth now |
| 25 Mar 2026 | £336,000 |
| 4 Oct 2019 | £235,000 |
73, Rowanswood Drive, Hyde SK14 3SA
| Today | See what it's worth now |
| 20 Mar 2026 | £460,000 |
| 22 Oct 2010 | £289,950 |
6, New Ridd Rise, Hyde SK14 5DD
| Today | See what it's worth now |
| 20 Mar 2026 | £240,000 |
| 25 Apr 2005 | £112,000 |
7, The Old Tannery, Shawcross Street, Hyde SK14 5PR

| Today | See what it's worth now |
| 20 Mar 2026 | £210,000 |
| 24 Oct 2024 | £195,000 |
Source Acknowledgement: © Crown copyright. England and Wales house price data is publicly available information produced by the HM Land Registry.This material was last updated on 9 July 2026. It covers the period from 1 January 1995 to 30 April 2026 and contains property transactions which have been registered during that period. Contains HM Land Registry data © Crown copyright and database right 2026. This data is licensed under the Open Government Licence v3.0.
Disclaimer: Rightmove.co.uk provides this HM Land Registry data "as is". The burden for fitness of the data relies completely with the user and is provided for informational purposes only. No warranty, express or implied, is given relating to the accuracy of content of the HM Land Registry data and Rightmove does not accept any liability for error or omission. If you have found an error with the data or need further information please contact HM Land Registry.
Permitted Use: Viewers of this Information are granted permission to access this Crown copyright material and to download it onto electronic, magnetic, optical or similar storage media provided that such activities are for private research, study or in-house use only. Any other use of the material requires the formal written permission of Land Registry which can be requested from us, and is subject to an additional licence and associated charge.
Rightmove takes no liability for your use of, or reliance on, Rightmove's Instant Valuation due to the limitations of our tracking tool listed here. Use of this tool is taken entirely at your own risk. All rights reserved.