
House Prices in IP5
House prices in IP5 have an overall average of £345,460 over the last year.
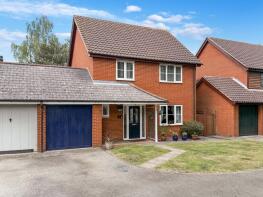
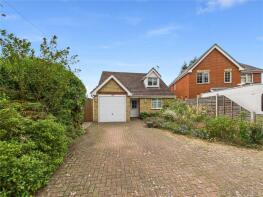
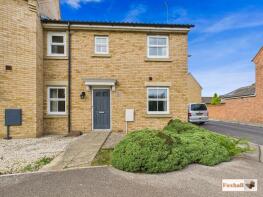
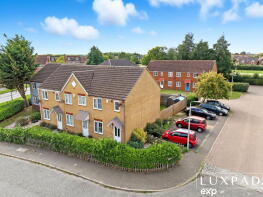
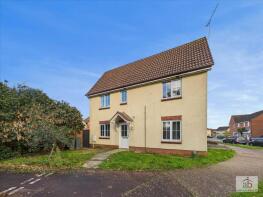
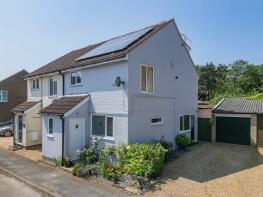
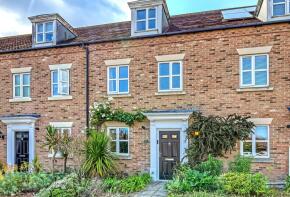
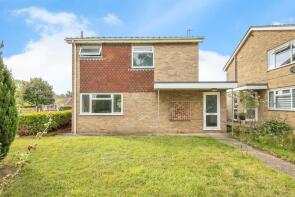
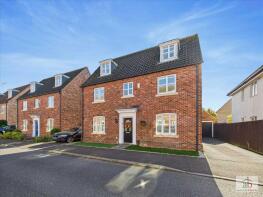
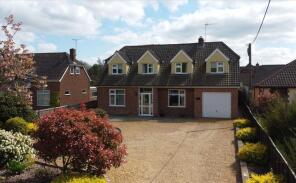
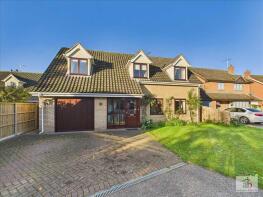
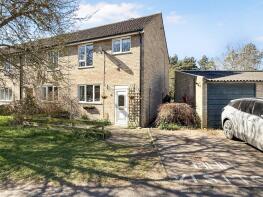
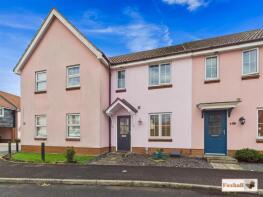
The majority of properties sold in IP5 during the last year were detached properties, selling for an average price of £428,880. Semi-detached properties sold for an average of £326,071, with terraced properties fetching £269,421.
Overall, the historical sold prices in IP5 over the last year were similar to the previous year and 4% down on the 2022 peak of £361,542.
Properties Sold
2, Sidecentre Gate, Eagle Way, Martlesham Heath, Ipswich IP5 3TY
| Today | See what it's worth now |
| 13 Apr 2026 | £381,000 |
| 22 Oct 2015 | £252,500 |
83b, Dobbs Lane, Ipswich IP5 2QH
| Today | See what it's worth now |
| 8 Apr 2026 | £365,000 |
| 3 Aug 2007 | £274,995 |
41, The Lloyds, Ipswich IP5 2WH

| Today | See what it's worth now |
| 1 Apr 2026 | £315,000 |
| 20 Dec 2002 | £142,000 |
Extensions and planning permission in IP5
See planning approval stats, extension build costs and value added estimates.

22, Halls Drift, Ipswich IP5 2DE
| Today | See what it's worth now |
| 31 Mar 2026 | £282,500 |
| 7 Apr 2006 | £192,995 |
No other historical records.
9, Wilding Drive, Ipswich IP5 2AE
| Today | See what it's worth now |
| 31 Mar 2026 | £215,000 |
| 23 May 2002 | £79,995 |
24, Nock Gardens, Ipswich IP5 2DU
| Today | See what it's worth now |
| 27 Mar 2026 | £250,000 |
| 8 Sep 2011 | £172,500 |
31, Coopers Road, Martlesham Heath, Ipswich IP5 3SJ
| Today | See what it's worth now |
| 27 Mar 2026 | £350,000 |
| 15 Feb 2016 | £213,500 |
77, Wilkinson Drive, Ipswich IP5 2DS
| Today | See what it's worth now |
| 20 Mar 2026 | £312,000 |
| 14 Nov 2008 | £165,000 |
34, Quebec Drive, Ipswich IP5 1HP

| Today | See what it's worth now |
| 20 Mar 2026 | £363,000 |
| 19 Jul 2002 | £124,500 |
No other historical records.
1, Birchwood Drive, Ipswich IP5 1EB
| Today | See what it's worth now |
| 20 Mar 2026 | £372,500 |
| 5 Aug 2021 | £335,000 |
No other historical records.
5, Peasey Gardens, Ipswich IP5 2GX
| Today | See what it's worth now |
| 19 Mar 2026 | £495,000 |
| 31 Jan 2006 | £249,000 |
No other historical records.
239, Main Road, Ipswich IP5 2PL
| Today | See what it's worth now |
| 19 Mar 2026 | £560,000 |
| 9 Oct 2007 | £365,000 |
43, Carlford Close, Martlesham Heath, Ipswich IP5 3TA
| Today | See what it's worth now |
| 19 Mar 2026 | £294,000 |
| 23 Dec 2009 | £186,000 |
No other historical records.
8, Peasey Gardens, Ipswich IP5 2GX
| Today | See what it's worth now |
| 19 Mar 2026 | £350,000 |
| 11 Oct 2012 | £205,000 |
1, Padstow Road, Ipswich IP5 1LH
| Today | See what it's worth now |
| 19 Mar 2026 | £286,500 |
| 20 Jul 2020 | £257,000 |
31, Howards Way, Ipswich IP5 2XN
| Today | See what it's worth now |
| 13 Mar 2026 | £385,000 |
| 7 Aug 2015 | £255,000 |
21, Laurel Avenue, Ipswich IP5 1HB

| Today | See what it's worth now |
| 13 Mar 2026 | £345,000 |
| 17 Sep 2014 | £237,500 |
54, Wilkinson Drive, Ipswich IP5 2DS
| Today | See what it's worth now |
| 13 Mar 2026 | £355,000 |
| 7 Mar 2013 | £183,000 |
80, Penzance Road, Ipswich IP5 1JU
| Today | See what it's worth now |
| 11 Mar 2026 | £345,000 |
| 24 Jun 2005 | £194,995 |
No other historical records.
47, Wright Lane, Ipswich IP5 2FA
| Today | See what it's worth now |
| 9 Mar 2026 | £435,000 |
| 24 Jan 2008 | £280,000 |
No other historical records.
7, Gressland Court, Mead Drive, Ipswich IP5 2HJ
| Today | See what it's worth now |
| 9 Mar 2026 | £287,500 |
| 30 Jun 2023 | £292,500 |
39, Coopers Road, Martlesham Heath, Ipswich IP5 3SJ
| Today | See what it's worth now |
| 9 Mar 2026 | £292,500 |
| 21 Nov 2017 | £248,000 |
47, Spindler Close, Ipswich IP5 2DA
| Today | See what it's worth now |
| 6 Mar 2026 | £226,000 |
| 23 Aug 2006 | £152,500 |
No other historical records.
Source Acknowledgement: © Crown copyright. England and Wales house price data is publicly available information produced by the HM Land Registry.This material was last updated on 9 July 2026. It covers the period from 1 January 1995 to 30 April 2026 and contains property transactions which have been registered during that period. Contains HM Land Registry data © Crown copyright and database right 2026. This data is licensed under the Open Government Licence v3.0.
Disclaimer: Rightmove.co.uk provides this HM Land Registry data "as is". The burden for fitness of the data relies completely with the user and is provided for informational purposes only. No warranty, express or implied, is given relating to the accuracy of content of the HM Land Registry data and Rightmove does not accept any liability for error or omission. If you have found an error with the data or need further information please contact HM Land Registry.
Permitted Use: Viewers of this Information are granted permission to access this Crown copyright material and to download it onto electronic, magnetic, optical or similar storage media provided that such activities are for private research, study or in-house use only. Any other use of the material requires the formal written permission of Land Registry which can be requested from us, and is subject to an additional licence and associated charge.
Rightmove takes no liability for your use of, or reliance on, Rightmove's Instant Valuation due to the limitations of our tracking tool listed here. Use of this tool is taken entirely at your own risk. All rights reserved.