
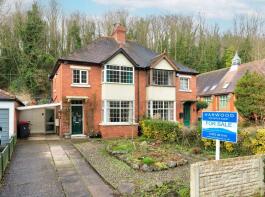
House Prices in Ironbridge
House prices in Ironbridge have an overall average of £275,833 over the last year.
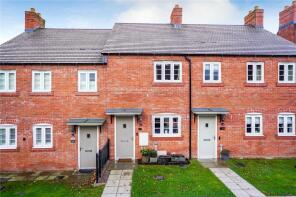
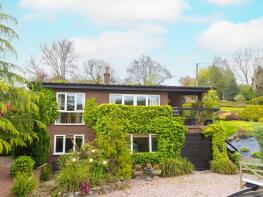
The majority of properties sold in Ironbridge during the last year were semi-detached properties, selling for an average price of £235,333. Detached properties sold for an average of £363,750, with terraced properties fetching £221,500.
Overall, the historical sold prices in Ironbridge over the last year were 2% up on the previous year and 10% down on the 2023 peak of £306,960.
Properties Sold
44 Albanoch, Paradise, Coalbrookdale, Telford TF8 7NW
| Today | See what it's worth now |
| 4 Mar 2026 | £290,000 |
| 25 Jul 2008 | £250,000 |
18, Mollett Drive, Ironbridge, Telford TF8 7BH
| Today | See what it's worth now |
| 19 Dec 2025 | £265,000 |
| 30 Sep 2020 | £234,950 |
No other historical records.
3, Hillside, Ironbridge, Telford TF8 7QR

| Today | See what it's worth now |
| 12 Dec 2025 | £395,000 |
| 9 Feb 2018 | £297,000 |
No other historical records.
12, Wrekin View, Madeley, Telford TF7 5HY
| Today | See what it's worth now |
| 5 Dec 2025 | £200,000 |
| 26 Jan 2021 | £164,950 |
1, Bath Road, Ironbridge, Telford TF8 7AY
| Today | See what it's worth now |
| 29 Oct 2025 | £240,000 |
| 15 Aug 2022 | £305,000 |
17, Kyrle Close, Ironbridge, Telford TF8 7BQ
| Today | See what it's worth now |
| 13 Oct 2025 | £223,000 |
| 10 Jul 2020 | £174,950 |
No other historical records.
32, Kyrle Close, Ironbridge, Telford TF8 7BQ
| Today | See what it's worth now |
| 10 Oct 2025 | £220,000 |
| 14 Feb 2020 | £199,950 |
No other historical records.
Towerscroft, Buildwas Road, Ironbridge, Telford TF8 7BJ
| Today | See what it's worth now |
| 22 Sep 2025 | £440,000 |
| 2 Dec 2011 | £265,000 |
15, Wrekin View, Madeley, Telford TF7 5HY
| Today | See what it's worth now |
| 9 Sep 2025 | £200,000 |
| 21 Feb 2017 | £127,000 |
No other historical records.
1, Mollett Drive, Ironbridge, Telford TF8 7BH

| Today | See what it's worth now |
| 22 Aug 2025 | £330,000 |
| 16 Oct 2020 | £294,950 |
No other historical records.
5, Dale View, Dale Road, Coalbrookdale, Telford TF8 7DL
| Today | See what it's worth now |
| 31 Jul 2025 | £347,000 |
| 13 Mar 2023 | £310,000 |
99, Wrekin View, Madeley, Telford TF7 5JD
| Today | See what it's worth now |
| 18 Jul 2025 | £160,000 |
No other historical records.
12, Mollett Drive, Ironbridge, Telford TF8 7BH
| Today | See what it's worth now |
| 27 Jun 2025 | £265,000 |
| 7 Sep 2020 | £234,950 |
No other historical records.
7, Mollett Drive, Ironbridge, Telford TF8 7BH
| Today | See what it's worth now |
| 16 Jun 2025 | £254,950 |
| 10 Jan 2020 | £234,950 |
No other historical records.
40, Paradise, Coalbrookdale, Telford TF8 7NP
| Today | See what it's worth now |
| 11 Jun 2025 | £210,000 |
| 8 Sep 2023 | £179,950 |
No other historical records.
3, Crown View, Hodge Bower, Ironbridge, Telford TF8 7BF
| Today | See what it's worth now |
| 10 Jun 2025 | £335,000 |
| 4 Dec 2018 | £248,000 |
No other historical records.
17 Coombe Cottage, Lincoln Hill, Ironbridge, Telford TF8 7NX
| Today | See what it's worth now |
| 2 Jun 2025 | £383,415 |
| 28 Jun 2021 | £350,000 |
79, Wrekin View, Madeley, Telford TF7 5JB
| Today | See what it's worth now |
| 23 May 2025 | £157,500 |
No other historical records.
Oak House, Waterloo Street, Ironbridge, Telford TF8 7AA
| Today | See what it's worth now |
| 22 May 2025 | £363,000 |
| 8 Jul 2021 | £310,000 |
1, Kyrle Close, Ironbridge, Telford TF8 7BQ
| Today | See what it's worth now |
| 15 May 2025 | £245,000 |
| 23 Aug 2019 | £169,950 |
No other historical records.
97, Wrekin View, Madeley, Telford TF7 5JD
| Today | See what it's worth now |
| 22 Apr 2025 | £205,000 |
| 19 Feb 2021 | £127,000 |
17, Wrekin View, Madeley, Telford TF7 5HY
| Today | See what it's worth now |
| 28 Mar 2025 | £205,000 |
| 18 Jan 2019 | £149,950 |
6, Dale View, Dale Road, Coalbrookdale, Telford TF8 7DL
| Today | See what it's worth now |
| 21 Mar 2025 | £338,850 |
| 30 Jun 2021 | £275,250 |

Source Acknowledgement: © Crown copyright. England and Wales house price data is publicly available information produced by the HM Land Registry.This material was last updated on 15 May 2026. It covers the period from 1 January 1995 to 31 March 2026 and contains property transactions which have been registered during that period. Contains HM Land Registry data © Crown copyright and database right 2026. This data is licensed under the Open Government Licence v3.0.
Disclaimer: Rightmove.co.uk provides this HM Land Registry data "as is". The burden for fitness of the data relies completely with the user and is provided for informational purposes only. No warranty, express or implied, is given relating to the accuracy of content of the HM Land Registry data and Rightmove does not accept any liability for error or omission. If you have found an error with the data or need further information please contact HM Land Registry.
Permitted Use: Viewers of this Information are granted permission to access this Crown copyright material and to download it onto electronic, magnetic, optical or similar storage media provided that such activities are for private research, study or in-house use only. Any other use of the material requires the formal written permission of Land Registry which can be requested from us, and is subject to an additional licence and associated charge.
Rightmove takes no liability for your use of, or reliance on, Rightmove's Instant Valuation due to the limitations of our tracking tool listed here. Use of this tool is taken entirely at your own risk. All rights reserved.