
House Prices in LE13
House prices in LE13 have an overall average of £240,576 over the last year.
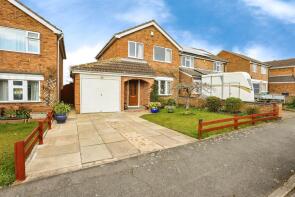
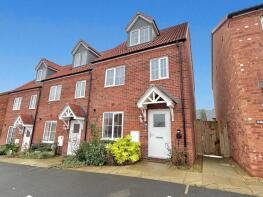
The majority of properties sold in LE13 during the last year were semi-detached properties, selling for an average price of £227,125. Detached properties sold for an average of £328,970, with terraced properties fetching £183,886.
Overall, the historical sold prices in LE13 over the last year were 10% down on the previous year and 12% down on the 2023 peak of £272,934.
Properties Sold
29, Norfolk Drive, Melton Mowbray LE13 0AJ
| Today | See what it's worth now |
| 23 Apr 2026 | £430,000 |
| 11 Oct 2011 | £230,000 |
No other historical records.
2, Denton Rise, Melton Mowbray LE13 1EU
| Today | See what it's worth now |
| 20 Apr 2026 | £235,000 |
| 20 Dec 2019 | £185,000 |
20, Framland Drive, Melton Mowbray LE13 1HY

| Today | See what it's worth now |
| 13 Apr 2026 | £217,500 |
| 7 Dec 2001 | £81,500 |
Extensions and planning permission in LE13
See planning approval stats, extension build costs and value added estimates.

108, Cranmere Road, Melton Mowbray LE13 1TB
| Today | See what it's worth now |
| 10 Apr 2026 | £300,000 |
| 24 Jan 2023 | £310,000 |
21, Lander Close, Melton Mowbray LE13 0XS
| Today | See what it's worth now |
| 10 Apr 2026 | £210,000 |
| 16 Dec 2022 | £229,950 |
No other historical records.
13, Wicklow Avenue, Melton Mowbray LE13 1DX
| Today | See what it's worth now |
| 8 Apr 2026 | £183,000 |
| 22 Feb 2022 | £205,000 |
No other historical records.
20, Swallowdale Road, Melton Mowbray LE13 0AU
| Today | See what it's worth now |
| 7 Apr 2026 | £255,000 |
No other historical records.
84, Buttermere Close, Melton Mowbray LE13 0LT
| Today | See what it's worth now |
| 7 Apr 2026 | £202,500 |
| 18 Oct 2013 | £152,500 |
7, Essex Close, Melton Mowbray LE13 1AP

| Today | See what it's worth now |
| 1 Apr 2026 | £583,000 |
| 7 Aug 2015 | £361,250 |
25, Elgin Drive, Melton Mowbray LE13 1TF
| Today | See what it's worth now |
| 1 Apr 2026 | £208,000 |
No other historical records.
27, Delamare Road, Melton Mowbray LE13 1PL

| Today | See what it's worth now |
| 31 Mar 2026 | £450,000 |
| 30 Jan 2009 | £230,000 |
5, Foxglove Avenue, Melton Mowbray LE13 0FQ
| Today | See what it's worth now |
| 31 Mar 2026 | £195,000 |
| 15 Oct 2008 | £138,000 |
9, Forbes Avenue, Melton Mowbray LE13 1FS
| Today | See what it's worth now |
| 27 Mar 2026 | £263,000 |
| 31 Oct 2022 | £261,900 |
No other historical records.
153, Grange Drive, Melton Mowbray LE13 1EZ
| Today | See what it's worth now |
| 27 Mar 2026 | £210,000 |
| 30 Jan 2020 | £161,000 |
58, Baldocks Lane, Melton Mowbray LE13 1EN
| Today | See what it's worth now |
| 27 Mar 2026 | £275,000 |
| 6 Nov 2020 | £243,500 |
Flat 3, 13 Broome House, Halifax Drive, Melton Mowbray LE13 0GL
| Today | See what it's worth now |
| 27 Mar 2026 | £125,000 |
| 13 Nov 2009 | £100,000 |
No other historical records.
4, Johnson Close, Melton Mowbray LE13 1TH
| Today | See what it's worth now |
| 26 Mar 2026 | £211,000 |
| 5 Dec 2013 | £178,000 |
No other historical records.
41, Shepherds Croft, Melton Mowbray LE13 1LG
| Today | See what it's worth now |
| 25 Mar 2026 | £210,000 |
| 25 Nov 2019 | £150,000 |
29, Bowley Avenue, Melton Mowbray LE13 1RU
| Today | See what it's worth now |
| 25 Mar 2026 | £230,000 |
| 4 Jul 2014 | £208,000 |
27, Rudbeck Avenue, Melton Mowbray LE13 0LH
| Today | See what it's worth now |
| 25 Mar 2026 | £176,000 |
No other historical records.
17, Grange Drive, Melton Mowbray LE13 1EY
| Today | See what it's worth now |
| 23 Mar 2026 | £235,500 |
| 20 Dec 2010 | £115,000 |
No other historical records.
24, Richmond Drive, Melton Mowbray LE13 0JP
| Today | See what it's worth now |
| 23 Mar 2026 | £390,000 |
| 5 Oct 2017 | £325,000 |
22, Oak Road, Melton Mowbray LE13 1BD
| Today | See what it's worth now |
| 20 Mar 2026 | £260,000 |
| 26 Jul 2012 | £105,000 |
No other historical records.


Source Acknowledgement: © Crown copyright. England and Wales house price data is publicly available information produced by the HM Land Registry.This material was last updated on 9 July 2026. It covers the period from 1 January 1995 to 30 April 2026 and contains property transactions which have been registered during that period. Contains HM Land Registry data © Crown copyright and database right 2026. This data is licensed under the Open Government Licence v3.0.
Disclaimer: Rightmove.co.uk provides this HM Land Registry data "as is". The burden for fitness of the data relies completely with the user and is provided for informational purposes only. No warranty, express or implied, is given relating to the accuracy of content of the HM Land Registry data and Rightmove does not accept any liability for error or omission. If you have found an error with the data or need further information please contact HM Land Registry.
Permitted Use: Viewers of this Information are granted permission to access this Crown copyright material and to download it onto electronic, magnetic, optical or similar storage media provided that such activities are for private research, study or in-house use only. Any other use of the material requires the formal written permission of Land Registry which can be requested from us, and is subject to an additional licence and associated charge.
Rightmove takes no liability for your use of, or reliance on, Rightmove's Instant Valuation due to the limitations of our tracking tool listed here. Use of this tool is taken entirely at your own risk. All rights reserved.