
House Prices in Lampeter
House prices in Lampeter have an overall average of £246,278 over the last year.
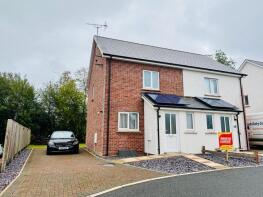
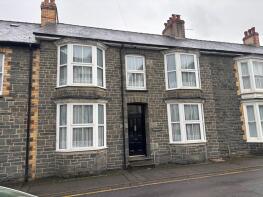
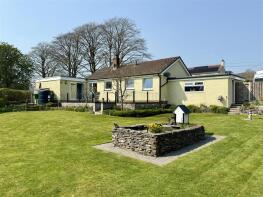
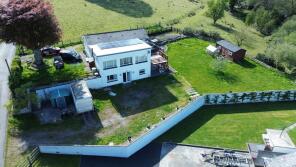
The majority of properties sold in Lampeter during the last year were detached properties, selling for an average price of £300,812. Terraced properties sold for an average of £196,800, with semi-detached properties fetching £180,000.
Overall, the historical sold prices in Lampeter over the last year were 1% up on the previous year and 2% down on the 2022 peak of £250,357.
Properties Sold
34, Cwrt Deri, Cwmann, Lampeter SA48 8EJ
| Today | See what it's worth now |
| 20 Apr 2026 | £185,000 |
| 25 May 2018 | £135,000 |
No other historical records.
Gellingwenin, Bryn Road, Lampeter SA48 7EE
| Today | See what it's worth now |
| 9 Apr 2026 | £290,000 |
| 10 Jun 2013 | £177,500 |
No other historical records.
New Hall, A485 Betws Bledrws, Lampeter SA48 8NX
| Today | See what it's worth now |
| 26 Mar 2026 | £290,000 |
| 10 Dec 1999 | £50,000 |
No other historical records.
Rhydfudr, Cribyn SA48 7NQ

| Today | See what it's worth now |
| 26 Mar 2026 | £425,000 |
| 19 Nov 2010 | £250,000 |
45, Penbryn, Lampeter SA48 7EU

| Today | See what it's worth now |
| 20 Mar 2026 | £175,000 |
| 24 Jun 2021 | £143,500 |
Brooklands, C1071 From Betws Bledrws To The Entrance To Blaenplwyf Farm, Lampeter SA48 8NX
| Today | See what it's worth now |
| 4 Mar 2026 | £258,500 |
| 12 Nov 2012 | £199,950 |
No other historical records.
9, Bro Tawela, Lampeter SA48 8AT
| Today | See what it's worth now |
| 4 Mar 2026 | £153,000 |
| 14 Nov 2022 | £125,000 |
No other historical records.
Trefin, New Street, Lampeter SA48 7AL
| Today | See what it's worth now |
| 2 Mar 2026 | £230,000 |
| 10 Dec 2019 | £147,500 |
No other historical records.
Dobehafan, C2179 From, Cwmann, Lampeter SA48 8DZ
| Today | See what it's worth now |
| 25 Feb 2026 | £260,000 |
| 26 Jul 2019 | £180,450 |
20, Bryn Yr Eglwys, Lampeter SA48 7ER
| Today | See what it's worth now |
| 19 Feb 2026 | £210,000 |
| 27 Apr 2011 | £157,000 |
Llwyn Ifan Cottage, Cellan SA48 8HY
| Today | See what it's worth now |
| 6 Feb 2026 | £325,000 |
| 5 May 2016 | £235,000 |
Rhandir, Gerynant, Cellan SA48 8HU
| Today | See what it's worth now |
| 6 Feb 2026 | £305,000 |
No other historical records.
3, Bromeillion, Lampeter SA48 8HZ
| Today | See what it's worth now |
| 15 Jan 2026 | £145,000 |
| 14 Dec 2017 | £92,000 |
No other historical records.
Penybanc Barn, Access Road, Ffarmers, Llanwrda SA19 8JZ
| Today | See what it's worth now |
| 14 Jan 2026 | £214,500 |
No other historical records.
35, Bryn Steffan, Lampeter SA48 8BS
| Today | See what it's worth now |
| 7 Jan 2026 | £140,000 |
| 1 Feb 2005 | £135,000 |
Caergrawnt, Treherbert Street, Cwmann, Lampeter SA48 8EL
| Today | See what it's worth now |
| 15 Dec 2025 | £310,000 |
| 22 Dec 2022 | £280,000 |
12, Heol Hathren, Cwmann, Lampeter SA48 8JR
| Today | See what it's worth now |
| 12 Dec 2025 | £152,000 |
| 28 Nov 2003 | £97,000 |
Flat 2, Glanyrafon, Cwrt Dulas, Lampeter SA48 7HY
| Today | See what it's worth now |
| 12 Dec 2025 | £133,000 |
| 18 May 2018 | £135,000 |
Geneu'r Glyn, New Street, Lampeter SA48 7AJ
| Today | See what it's worth now |
| 11 Dec 2025 | £365,000 |
| 18 Mar 2011 | £190,000 |
No other historical records.
3, Teifi Terrace, Lampeter SA48 7AN
| Today | See what it's worth now |
| 5 Dec 2025 | £155,000 |
| 30 Oct 2009 | £110,000 |
No other historical records.
19, Station Terrace, Lampeter SA48 7HH
| Today | See what it's worth now |
| 28 Nov 2025 | £240,000 |
| 30 May 2019 | £146,000 |
29, Maes Y Deri, Lampeter SA48 7EP
| Today | See what it's worth now |
| 10 Nov 2025 | £110,000 |
| 6 Jul 2010 | £84,000 |
No other historical records.
Llaindelyn, Silian SA48 8NU

| Today | See what it's worth now |
| 5 Nov 2025 | £353,000 |
| 16 Jul 2018 | £170,000 |
No other historical records.
Source Acknowledgement: © Crown copyright. England and Wales house price data is publicly available information produced by the HM Land Registry.This material was last updated on 9 July 2026. It covers the period from 1 January 1995 to 30 April 2026 and contains property transactions which have been registered during that period. Contains HM Land Registry data © Crown copyright and database right 2026. This data is licensed under the Open Government Licence v3.0.
Disclaimer: Rightmove.co.uk provides this HM Land Registry data "as is". The burden for fitness of the data relies completely with the user and is provided for informational purposes only. No warranty, express or implied, is given relating to the accuracy of content of the HM Land Registry data and Rightmove does not accept any liability for error or omission. If you have found an error with the data or need further information please contact HM Land Registry.
Permitted Use: Viewers of this Information are granted permission to access this Crown copyright material and to download it onto electronic, magnetic, optical or similar storage media provided that such activities are for private research, study or in-house use only. Any other use of the material requires the formal written permission of Land Registry which can be requested from us, and is subject to an additional licence and associated charge.
Rightmove takes no liability for your use of, or reliance on, Rightmove's Instant Valuation due to the limitations of our tracking tool listed here. Use of this tool is taken entirely at your own risk. All rights reserved.