
House Prices in Langland
House prices in Langland have an overall average of £550,556 over the last year.
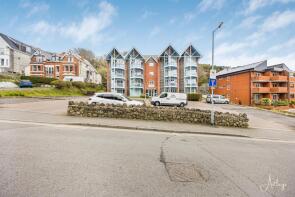
The majority of properties sold in Langland during the last year were detached properties, selling for an average price of £658,333. Flats sold for an average of £267,500, with semi-detached properties fetching £470,000.
Overall, the historical sold prices in Langland over the last year were 5% down on the previous year and 10% up on the 2018 peak of £499,355.
Properties Sold
4, Tor House, Rotherslade Road, Langland, Swansea SA3 4QW
| Today | See what it's worth now |
| 13 Nov 2025 | £350,000 |
| 9 Feb 2024 | £350,000 |
85, Higher Lane, Langland, Swansea SA3 4PD
| Today | See what it's worth now |
| 5 Nov 2025 | £705,000 |
| 22 Aug 2019 | £412,000 |
No other historical records.
11, Cambridge Close, Langland, Swansea SA3 4PF
| Today | See what it's worth now |
| 3 Oct 2025 | £470,000 |
| 30 Jun 2021 | £950,000 |
10, Somerset Road, Langland, Swansea SA3 4PG
| Today | See what it's worth now |
| 29 Aug 2025 | £615,000 |
| 29 Jan 2021 | £420,000 |
No other historical records.
26, Brynfield Court, Langland, Swansea SA3 4TF

| Today | See what it's worth now |
| 30 Jun 2025 | £185,000 |
| 31 Oct 2002 | £130,000 |
21, Wychwood Close, Langland, Swansea SA3 4PH


| Today | See what it's worth now |
| 18 Jun 2025 | £545,000 |
No other historical records.
24, Worcester Drive, Langland, Swansea SA3 4HL
| Today | See what it's worth now |
| 17 Jun 2025 | £460,000 |
No other historical records.
15, Southward Lane, Langland, Swansea SA3 4QE

| Today | See what it's worth now |
| 11 Jun 2025 | £575,000 |
| 21 Apr 2004 | £269,950 |
No other historical records.
75, Higher Lane, Langland, Swansea SA3 4PD

| Today | See what it's worth now |
| 6 Jun 2025 | £1,050,000 |
| 5 Aug 2019 | £452,500 |
No other historical records.
3, Hill Crest, Langland, Swansea SA3 4PW
| Today | See what it's worth now |
| 25 Mar 2025 | £1,335,000 |
| 14 May 2015 | £1,000,000 |
10, Lansdowne, Langland, Swansea SA3 4QX

| Today | See what it's worth now |
| 7 Mar 2025 | £170,000 |
| 12 Sep 2003 | £135,000 |
2b, Links Court, Langland Bay Road, Langland, Swansea SA3 4QR

| Today | See what it's worth now |
| 5 Feb 2025 | £510,000 |
| 8 May 1998 | £91,500 |
No other historical records.
22, Wychwood Close, Langland, Swansea SA3 4PH

| Today | See what it's worth now |
| 22 Jan 2025 | £650,000 |
No other historical records.
22, Amberley Drive, Langland, Swansea SA3 4PJ
| Today | See what it's worth now |
| 20 Jan 2025 | £460,000 |
| 21 Jul 1999 | £129,500 |
12, Cambridge Gardens, Langland, Swansea SA3 4PP
| Today | See what it's worth now |
| 10 Jan 2025 | £510,000 |
| 5 Oct 2001 | £239,000 |
9 Nooaks, Langland Court Road, Langland, Swansea SA3 4TB

| Today | See what it's worth now |
| 3 Jan 2025 | £1,400,000 |
| 28 Jul 2010 | £770,000 |
35, Rotherslade Road, Langland, Swansea SA3 4QW
| Today | See what it's worth now |
| 31 Oct 2024 | £575,000 |
No other historical records.
Flat 18, Gilbertscliffe, Southward Lane, Langland, Swansea SA3 4QS

| Today | See what it's worth now |
| 30 Oct 2024 | £160,000 |
| 18 Aug 2023 | £133,000 |
No other historical records.
8, Highcliffe Court, Langland Court Road, Langland, Swansea SA3 4TQ

| Today | See what it's worth now |
| 29 Oct 2024 | £350,000 |
No other historical records.
22 South Lynn, Langland Bay Road, Langland, Swansea SA3 4QQ

| Today | See what it's worth now |
| 28 Oct 2024 | £685,000 |
| 31 Mar 2010 | £1,175,000 |
No other historical records.
12, Tor House, Rotherslade Road, Langland, Swansea SA3 4QN
| Today | See what it's worth now |
| 28 Oct 2024 | £485,000 |
| 23 Jan 2017 | £375,000 |
11, Tor House, Rotherslade Road, Langland, Swansea SA3 4QN
| Today | See what it's worth now |
| 28 Oct 2024 | £455,000 |
| 19 Dec 2003 | £297,000 |
16b, Overland Road, Mumbles, Swansea SA3 4LP

| Today | See what it's worth now |
| 2 Oct 2024 | £270,000 |
| 22 Dec 1998 | £70,000 |
No other historical records.
Flat 1, 13 Ael Y Don, Langland Bay Road, Langland, Swansea SA3 4QP

| Today | See what it's worth now |
| 30 Aug 2024 | £778,000 |
| 26 Oct 2012 | £473,000 |
21, Fairhaven Court, Langland, Swansea SA3 4QY

| Today | See what it's worth now |
| 30 Aug 2024 | £282,500 |
| 9 Nov 2007 | £210,000 |
Source Acknowledgement: © Crown copyright. England and Wales house price data is publicly available information produced by the HM Land Registry.This material was last updated on 4 February 2026. It covers the period from 1 January 1995 to 24 December 2025 and contains property transactions which have been registered during that period. Contains HM Land Registry data © Crown copyright and database right 2026. This data is licensed under the Open Government Licence v3.0.
Disclaimer: Rightmove.co.uk provides this HM Land Registry data "as is". The burden for fitness of the data relies completely with the user and is provided for informational purposes only. No warranty, express or implied, is given relating to the accuracy of content of the HM Land Registry data and Rightmove does not accept any liability for error or omission. If you have found an error with the data or need further information please contact HM Land Registry.
Permitted Use: Viewers of this Information are granted permission to access this Crown copyright material and to download it onto electronic, magnetic, optical or similar storage media provided that such activities are for private research, study or in-house use only. Any other use of the material requires the formal written permission of Land Registry which can be requested from us, and is subject to an additional licence and associated charge.
Map data ©OpenStreetMap contributors.
Rightmove takes no liability for your use of, or reliance on, Rightmove's Instant Valuation due to the limitations of our tracking tool listed here. Use of this tool is taken entirely at your own risk. All rights reserved.