
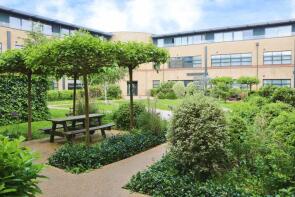
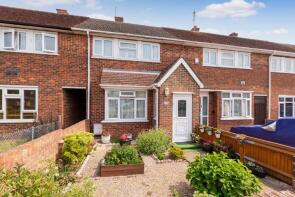
House Prices in Langley
House prices in Langley have an overall average of £473,971 over the last year.
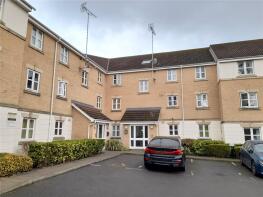
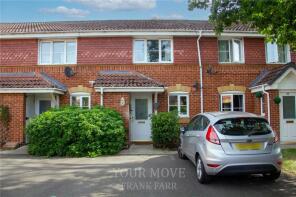
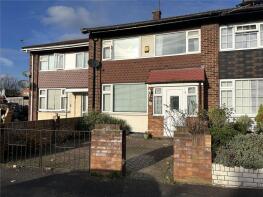
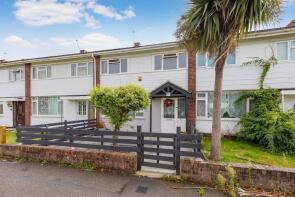
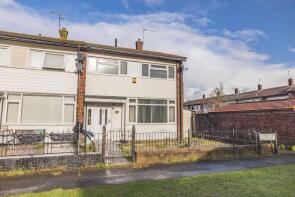
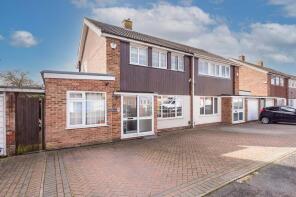
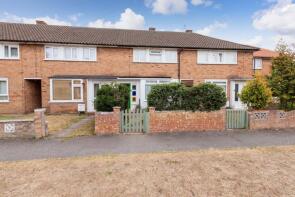
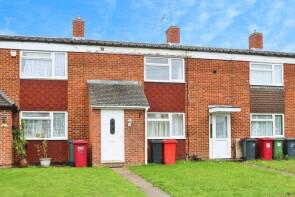
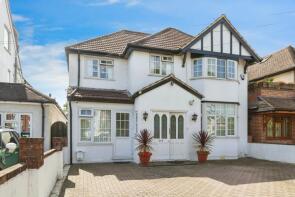
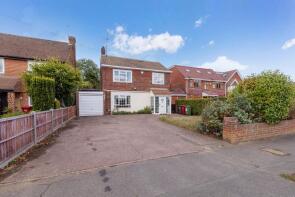
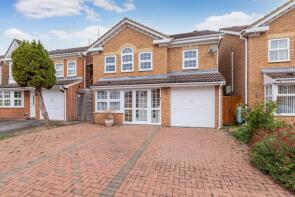
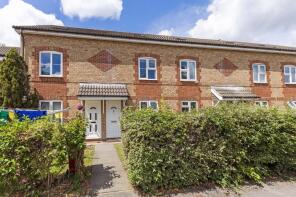
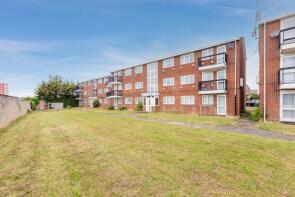
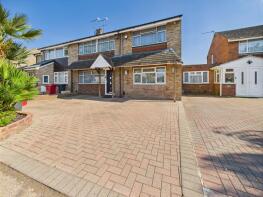
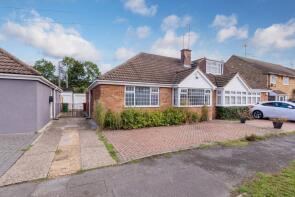
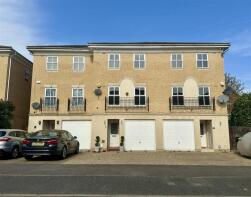
The majority of properties sold in Langley during the last year were terraced properties, selling for an average price of £429,656. Semi-detached properties sold for an average of £586,012, with flats fetching £233,674.
Overall, the historical sold prices in Langley over the last year were 1% up on the previous year and 2% down on the 2023 peak of £481,728.
Properties Sold
119, Gosling Road, Slough SL3 7TN

| Today | See what it's worth now |
| 27 Apr 2026 | £460,000 |
| 17 Feb 2006 | £220,000 |
No other historical records.
9, Scholars Walk, Slough SL3 8LY
| Today | See what it's worth now |
| 8 Apr 2026 | £255,000 |
| 30 Dec 2002 | £141,995 |
No other historical records.
26, Bessemer Close, Slough SL3 7HD
| Today | See what it's worth now |
| 25 Mar 2026 | £390,000 |
| 9 May 2018 | £362,500 |
40, Humber Way, Slough SL3 8ST
| Today | See what it's worth now |
| 25 Mar 2026 | £410,000 |
| 8 Jul 2016 | £365,000 |
91, Tamar Way, Slough SL3 8SY
| Today | See what it's worth now |
| 6 Mar 2026 | £430,000 |
| 10 Jan 2002 | £137,000 |
No other historical records.
Flat 81, Hurricane Court, Heron Drive, Slough SL3 8FA
| Today | See what it's worth now |
| 6 Mar 2026 | £245,000 |
| 19 Aug 2020 | £285,000 |
No other historical records.
7, Marlborough Road, Slough SL3 7JW
| Today | See what it's worth now |
| 25 Feb 2026 | £740,000 |
No other historical records.
113, Humber Way, Slough SL3 8SR
| Today | See what it's worth now |
| 20 Feb 2026 | £420,000 |
No other historical records.
278, Langley Road, Slough SL3 7EG

| Today | See what it's worth now |
| 19 Feb 2026 | £765,000 |
| 8 May 1998 | £134,000 |
No other historical records.
45, Laburnum Grove, Slough SL3 8QT
| Today | See what it's worth now |
| 17 Feb 2026 | £500,000 |
| 30 Aug 2013 | £268,000 |
No other historical records.
35, Parry Green South, Slough SL3 8NN
| Today | See what it's worth now |
| 16 Feb 2026 | £380,000 |
No other historical records.
58, Trelawney Avenue, Slough SL3 8RW
| Today | See what it's worth now |
| 16 Feb 2026 | £415,000 |
| 20 Dec 2007 | £230,000 |
50, Minster Way, Slough SL3 7EX
| Today | See what it's worth now |
| 13 Feb 2026 | £370,000 |
| 14 Jun 2013 | £204,950 |
41a, Swabey Road, Slough SL3 8NR
| Today | See what it's worth now |
| 13 Feb 2026 | £460,000 |
No other historical records.
40, Rockall Court, Slough SL3 8EZ
| Today | See what it's worth now |
| 12 Feb 2026 | £200,000 |
| 3 Oct 2014 | £162,500 |
Flat 47, Hurricane Court, Heron Drive, Slough SL3 8FA

| Today | See what it's worth now |
| 12 Feb 2026 | £255,000 |
| 15 Dec 2021 | £257,500 |
No other historical records.
318, London Road, Slough SL3 7HU
| Today | See what it's worth now |
| 10 Feb 2026 | £920,000 |
| 30 Jun 1998 | £133,000 |
No other historical records.
60, Upton Court Road, Slough SL3 7LZ
| Today | See what it's worth now |
| 9 Feb 2026 | £970,000 |
No other historical records.
15, Southwold Spur, Slough SL3 8XX
| Today | See what it's worth now |
| 6 Feb 2026 | £680,000 |
No other historical records.
51, Maplin Park, Slough SL3 8YB
| Today | See what it's worth now |
| 6 Feb 2026 | £280,000 |
| 9 May 2019 | £265,000 |
20, Grampian Way, Slough SL3 8UG
| Today | See what it's worth now |
| 3 Feb 2026 | £225,000 |
No other historical records.
14, Sharney Avenue, Slough SL3 8EA
| Today | See what it's worth now |
| 30 Jan 2026 | £820,000 |
| 28 Feb 2002 | £248,000 |
No other historical records.
37, Alderbury Road, Slough SL3 8DJ
| Today | See what it's worth now |
| 30 Jan 2026 | £505,000 |
| 7 Jan 2019 | £375,000 |
Source Acknowledgement: © Crown copyright. England and Wales house price data is publicly available information produced by the HM Land Registry.This material was last updated on 9 July 2026. It covers the period from 1 January 1995 to 30 April 2026 and contains property transactions which have been registered during that period. Contains HM Land Registry data © Crown copyright and database right 2026. This data is licensed under the Open Government Licence v3.0.
Disclaimer: Rightmove.co.uk provides this HM Land Registry data "as is". The burden for fitness of the data relies completely with the user and is provided for informational purposes only. No warranty, express or implied, is given relating to the accuracy of content of the HM Land Registry data and Rightmove does not accept any liability for error or omission. If you have found an error with the data or need further information please contact HM Land Registry.
Permitted Use: Viewers of this Information are granted permission to access this Crown copyright material and to download it onto electronic, magnetic, optical or similar storage media provided that such activities are for private research, study or in-house use only. Any other use of the material requires the formal written permission of Land Registry which can be requested from us, and is subject to an additional licence and associated charge.
Rightmove takes no liability for your use of, or reliance on, Rightmove's Instant Valuation due to the limitations of our tracking tool listed here. Use of this tool is taken entirely at your own risk. All rights reserved.