
House Prices in Leatherhead
House prices in Leatherhead have an overall average of £563,206 over the last year.
The majority of properties sold in Leatherhead during the last year were flats, selling for an average price of £251,224. Detached properties sold for an average of £1,301,532, with semi-detached properties fetching £520,507.
Overall, the historical sold prices in Leatherhead over the last year were 18% up on the previous year and 6% up on the 2021 peak of £532,588.
Properties Sold
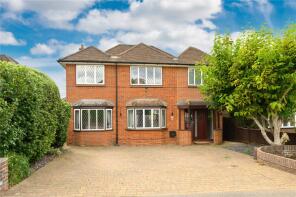
1, Kingston Square, Buffers Lane, Leatherhead KT22 7XP
| Today | See what it's worth now |
| 23 Apr 2026 | £251,500 |
| 23 Sep 2022 | £280,000 |
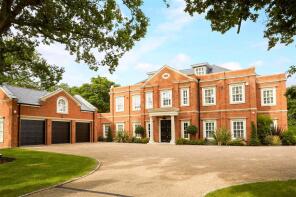
Fairoaks Lodge, Pachesham Park, Leatherhead KT22 0DJ
| Today | See what it's worth now |
| 16 Apr 2026 | £5,750,000 |
| 20 Jan 2014 | £1,400,000 |
No other historical records.
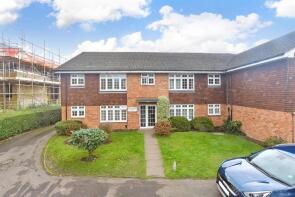
Flat 1, 15 Grosvenor Court, Epsom Road, Leatherhead KT22 8SW
| Today | See what it's worth now |
| 10 Apr 2026 | £312,500 |
| 28 Jan 2022 | £280,000 |
11, Parr Close, Leatherhead KT22 7HD

| Today | See what it's worth now |
| 10 Apr 2026 | £468,000 |
| 28 Jul 1999 | £142,500 |
No other historical records.
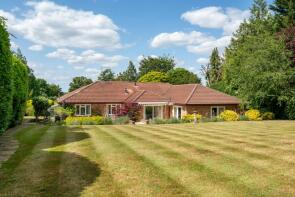
Coppers, The Downs, Leatherhead KT22 8LH
| Today | See what it's worth now |
| 1 Apr 2026 | £1,335,000 |
| 3 Oct 2011 | £820,000 |
No other historical records.
2, East Lodge, Epsom Road, Leatherhead KT22 8TG
| Today | See what it's worth now |
| 30 Mar 2026 | £200,000 |
| 29 Sep 2021 | £190,000 |
31, St Johns Road, Leatherhead KT22 8SE
| Today | See what it's worth now |
| 30 Mar 2026 | £495,000 |
| 5 Jun 2020 | £440,000 |
9, Queen Annes Terrace, Leatherhead KT22 7HR
| Today | See what it's worth now |
| 25 Mar 2026 | £685,000 |
| 1 Dec 2020 | £610,000 |
10, Oaks Court, Oaks Close, Leatherhead KT22 7SJ
| Today | See what it's worth now |
| 24 Mar 2026 | £445,000 |
| 28 Oct 2022 | £450,000 |
9, Beauclare Close, Leatherhead KT22 8UB
| Today | See what it's worth now |
| 20 Mar 2026 | £800,000 |
| 24 Aug 2007 | £440,000 |
16, Melvinshaw, Leatherhead KT22 8SX
| Today | See what it's worth now |
| 18 Mar 2026 | £800,000 |
| 1 Sep 2020 | £735,000 |
No other historical records.
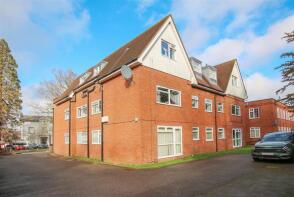
Flat 10, Fountain House, Cleeve Road, Leatherhead KT22 7LX
| Today | See what it's worth now |
| 18 Mar 2026 | £230,000 |
| 26 Nov 2021 | £255,000 |
No other historical records.
31, Sheridan House, Highbury Drive, Leatherhead KT22 7UN
| Today | See what it's worth now |
| 12 Mar 2026 | £275,000 |
| 26 Feb 2021 | £290,000 |
6, Cedar House, Park View Road, Leatherhead KT22 7GB
| Today | See what it's worth now |
| 10 Mar 2026 | £235,000 |
| 22 Jun 2007 | £247,495 |
No other historical records.
11, 27 Emmeline Lodge, Kingston Avenue, Leatherhead KT22 7FU
| Today | See what it's worth now |
| 6 Mar 2026 | £200,000 |
| 31 May 2018 | £293,450 |
No other historical records.
40, Kingston Square, Buffers Lane, Leatherhead KT22 7XP

| Today | See what it's worth now |
| 6 Mar 2026 | £225,000 |
| 17 Jan 2022 | £225,000 |
67, Cleeve Road, Leatherhead KT22 7NH
| Today | See what it's worth now |
| 5 Mar 2026 | £450,000 |
| 16 Feb 2021 | £380,000 |
3, Sherborne Walk, Windfield, Leatherhead KT22 8UL
| Today | See what it's worth now |
| 4 Mar 2026 | £639,000 |
| 29 Nov 1996 | £143,000 |
No other historical records.
131, Kingston Road, Leatherhead KT22 7NT
| Today | See what it's worth now |
| 2 Mar 2026 | £425,000 |
| 1 Dec 2021 | £410,000 |
59, Windfield, Leatherhead KT22 8UH
| Today | See what it's worth now |
| 27 Feb 2026 | £532,950 |
| 16 Jan 2013 | £365,000 |
Flat 15, Holly Court, Belmont Road, Leatherhead KT22 7DX
| Today | See what it's worth now |
| 26 Feb 2026 | £170,000 |
| 3 Jul 2009 | £175,000 |
15, Hartfield Road, Leatherhead KT22 0AR
| Today | See what it's worth now |
| 20 Feb 2026 | £580,000 |
| 29 Mar 2018 | £549,500 |
No other historical records.
1, Linden Road, Leatherhead KT22 7JF
| Today | See what it's worth now |
| 20 Feb 2026 | £725,000 |
| 23 Aug 2019 | £612,500 |

Source Acknowledgement: © Crown copyright. England and Wales house price data is publicly available information produced by the HM Land Registry.This material was last updated on 9 July 2026. It covers the period from 1 January 1995 to 30 April 2026 and contains property transactions which have been registered during that period. Contains HM Land Registry data © Crown copyright and database right 2026. This data is licensed under the Open Government Licence v3.0.
Disclaimer: Rightmove.co.uk provides this HM Land Registry data "as is". The burden for fitness of the data relies completely with the user and is provided for informational purposes only. No warranty, express or implied, is given relating to the accuracy of content of the HM Land Registry data and Rightmove does not accept any liability for error or omission. If you have found an error with the data or need further information please contact HM Land Registry.
Permitted Use: Viewers of this Information are granted permission to access this Crown copyright material and to download it onto electronic, magnetic, optical or similar storage media provided that such activities are for private research, study or in-house use only. Any other use of the material requires the formal written permission of Land Registry which can be requested from us, and is subject to an additional licence and associated charge.
Rightmove takes no liability for your use of, or reliance on, Rightmove's Instant Valuation due to the limitations of our tracking tool listed here. Use of this tool is taken entirely at your own risk. All rights reserved.