
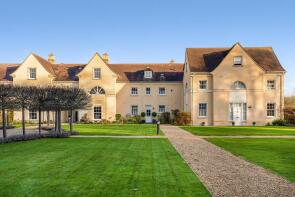
House Prices in Lechlade
House prices in Lechlade have an overall average of £574,038 over the last year.
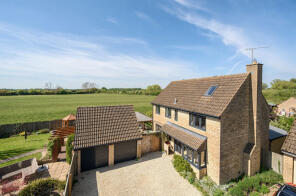
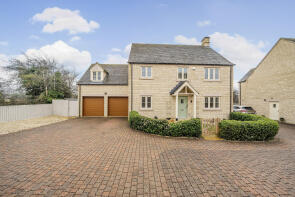
The majority of properties sold in Lechlade during the last year were detached properties, selling for an average price of £799,946. Terraced properties sold for an average of £379,033, with semi-detached properties fetching £273,333.
Overall, the historical sold prices in Lechlade over the last year were 3% down on the previous year and 4% down on the 2022 peak of £597,381.
Properties Sold
31, Gassons Road, Lechlade GL7 3BQ
| Today | See what it's worth now |
| 31 Mar 2026 | £350,000 |
| 2 Nov 2021 | £185,000 |
No other historical records.
5, Thames Street, Lechlade GL7 3AG
| Today | See what it's worth now |
| 13 Mar 2026 | £221,500 |
| 27 Oct 2017 | £152,000 |
No other historical records.
6, Thames Street, Lechlade GL7 3AG
| Today | See what it's worth now |
| 13 Mar 2026 | £220,000 |
No other historical records.
2, The Gables, Burford Road, Lechlade GL7 3ET
| Today | See what it's worth now |
| 27 Feb 2026 | £202,500 |
| 13 Dec 2010 | £152,000 |
4, Orchard Close, Lechlade GL7 3EF
| Today | See what it's worth now |
| 17 Feb 2026 | £955,000 |
| 14 May 2015 | £625,000 |
44, Kingsmead, Lechlade GL7 3BW
| Today | See what it's worth now |
| 12 Feb 2026 | £600,000 |
| 30 Jan 2015 | £392,500 |
No other historical records.
1, The Cursus, Lechlade GL7 3SB
| Today | See what it's worth now |
| 28 Jan 2026 | £535,000 |
| 30 Apr 2019 | £236,671 |
No other historical records.
3, Gales Court, Lechlade GL7 3DG
| Today | See what it's worth now |
| 19 Jan 2026 | £360,000 |
| 19 Jul 2019 | £247,500 |
20, The Stables, Lechlade GL7 3FE
| Today | See what it's worth now |
| 9 Jan 2026 | £735,000 |
| 3 Nov 2022 | £600,000 |
7, Manor Gardens, Oak Street, Lechlade GL7 3EQ
| Today | See what it's worth now |
| 17 Dec 2025 | £520,000 |
| 25 May 2018 | £333,760 |
11, St Johns Street, Lechlade GL7 3AT
| Today | See what it's worth now |
| 28 Nov 2025 | £255,000 |
| 5 Jan 2004 | £146,000 |
No other historical records.
2, The Cursus, Lechlade GL7 3SB
| Today | See what it's worth now |
| 10 Nov 2025 | £590,000 |
| 22 Jan 2007 | £465,000 |
No other historical records.
26, The Wern, Lechlade GL7 3FF
| Today | See what it's worth now |
| 7 Nov 2025 | £720,000 |
| 31 Oct 2011 | £485,000 |
15, Lodersfield, Lechlade GL7 3DJ
| Today | See what it's worth now |
| 7 Nov 2025 | £930,000 |
| 17 Mar 1995 | £125,000 |
No other historical records.
2, Butlers Field, Lechlade GL7 3DF
| Today | See what it's worth now |
| 10 Oct 2025 | £250,000 |
| 16 Oct 2001 | £115,000 |
No other historical records.
101, Perrinsfield, Lechlade GL7 3SE
| Today | See what it's worth now |
| 1 Oct 2025 | £323,500 |
| 30 May 2014 | £218,000 |
Claydon Pike Lake, London Road, Claydon Pike, Lechlade GL7 3DT
| Today | See what it's worth now |
| 26 Sep 2025 | £2,700,000 |
| 18 Oct 2024 | £4,125,000 |
Stonehouse, Burford Street, Lechlade GL7 3AP
| Today | See what it's worth now |
| 18 Sep 2025 | £440,000 |
No other historical records.
4, Swansfield, Lechlade GL7 3SF
| Today | See what it's worth now |
| 17 Sep 2025 | £232,500 |
| 28 Feb 2018 | £205,000 |
Cobs Cottage, Swan Close, Lechlade GL7 3BY
| Today | See what it's worth now |
| 17 Sep 2025 | £475,000 |
| 7 May 1997 | £100,000 |
No other historical records.
20, The Cursus, Lechlade GL7 3SB
| Today | See what it's worth now |
| 9 Sep 2025 | £775,000 |
| 1 Jul 2020 | £465,000 |
No other historical records.
7, Stephens Close, Downington, Lechlade GL7 3FP
| Today | See what it's worth now |
| 20 Aug 2025 | £820,000 |
| 21 Jul 2017 | £525,000 |
No other historical records.
1, West Allcourt, Lechlade GL7 3FA
| Today | See what it's worth now |
| 14 Aug 2025 | £475,000 |
| 8 Oct 2020 | £427,000 |
Source Acknowledgement: © Crown copyright. England and Wales house price data is publicly available information produced by the HM Land Registry.This material was last updated on 9 July 2026. It covers the period from 1 January 1995 to 30 April 2026 and contains property transactions which have been registered during that period. Contains HM Land Registry data © Crown copyright and database right 2026. This data is licensed under the Open Government Licence v3.0.
Disclaimer: Rightmove.co.uk provides this HM Land Registry data "as is". The burden for fitness of the data relies completely with the user and is provided for informational purposes only. No warranty, express or implied, is given relating to the accuracy of content of the HM Land Registry data and Rightmove does not accept any liability for error or omission. If you have found an error with the data or need further information please contact HM Land Registry.
Permitted Use: Viewers of this Information are granted permission to access this Crown copyright material and to download it onto electronic, magnetic, optical or similar storage media provided that such activities are for private research, study or in-house use only. Any other use of the material requires the formal written permission of Land Registry which can be requested from us, and is subject to an additional licence and associated charge.
Rightmove takes no liability for your use of, or reliance on, Rightmove's Instant Valuation due to the limitations of our tracking tool listed here. Use of this tool is taken entirely at your own risk. All rights reserved.