
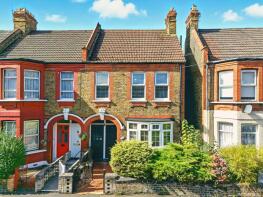
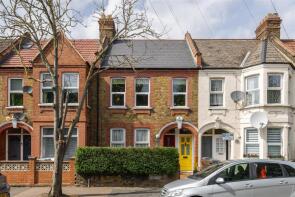
House Prices in Leyton Marshes
House prices in Leyton Marshes have an overall average of £538,966 over the last year.
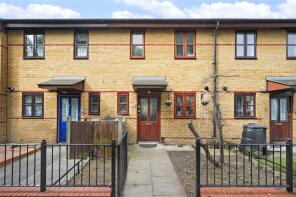
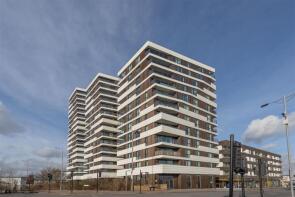
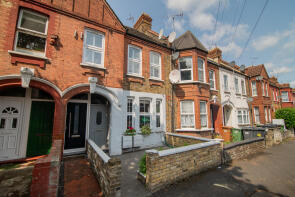
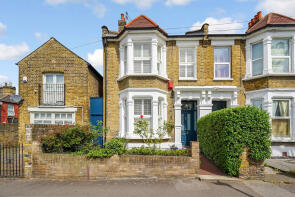
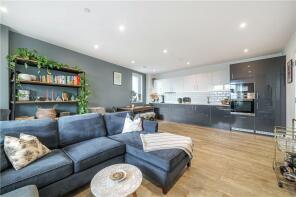
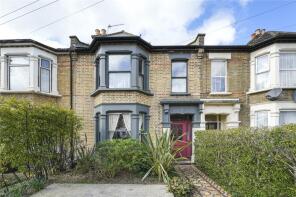
The majority of properties sold in Leyton Marshes during the last year were flats, selling for an average price of £383,151. Terraced properties sold for an average of £710,304, with semi-detached properties fetching £650,000.
Overall, the historical sold prices in Leyton Marshes over the last year were 16% up on the previous year and 13% up on the 2022 peak of £477,104.
Properties Sold
90, Grange Park Road, London E10 5ES
| Today | See what it's worth now |
| 19 Mar 2026 | £815,000 |
| 10 Jul 2015 | £527,500 |
55, Leasowes Road, London E10 7BE
| Today | See what it's worth now |
| 13 Mar 2026 | £850,000 |
| 22 Oct 2014 | £400,000 |
No other historical records.
116, Grange Park Road, London E10 5EU
| Today | See what it's worth now |
| 26 Feb 2026 | £880,000 |
| 14 Oct 2021 | £566,500 |
No other historical records.
34, Etloe House, Church Road, Leyton E10 7DF
| Today | See what it's worth now |
| 26 Feb 2026 | £110,000 |
No other historical records.
28, Kettlebaston Road, London E10 7PF
| Today | See what it's worth now |
| 25 Feb 2026 | £435,500 |
| 28 Jun 2021 | £300,000 |
153, Beck Square, London E10 7FZ

| Today | See what it's worth now |
| 20 Feb 2026 | £410,000 |
| 1 Apr 2020 | £455,900 |
No other historical records.
17, 180 Etloe House, Church Road, London E10 7DF

| Today | See what it's worth now |
| 13 Feb 2026 | £130,000 |
| 28 Jun 2016 | £100,000 |
17, Marconi Road, London E10 7JD
| Today | See what it's worth now |
| 6 Feb 2026 | £465,000 |
| 18 Sep 2020 | £400,000 |
16, Bickley Road, London E10 7AQ
| Today | See what it's worth now |
| 5 Feb 2026 | £910,000 |
| 7 May 2021 | £660,000 |
57, Sunnyside Road, London E10 7BB
| Today | See what it's worth now |
| 5 Feb 2026 | £930,000 |
| 10 Nov 2016 | £580,000 |
No other historical records.
5, Frobisher Gardens, Westerham Road, London E10 7AY
| Today | See what it's worth now |
| 30 Jan 2026 | £487,500 |
| 28 Jun 2019 | £408,000 |
No other historical records.
104, Beck Square, London E10 7FY
| Today | See what it's worth now |
| 30 Jan 2026 | £462,000 |
| 13 Dec 2019 | £480,000 |
No other historical records.
50, Kettlebaston Road, London E10 7PF
| Today | See what it's worth now |
| 29 Jan 2026 | £395,500 |
| 21 Mar 2022 | £351,000 |
3, Malta Road, London E10 7JT
| Today | See what it's worth now |
| 23 Jan 2026 | £796,000 |
| 14 Apr 2025 | £307,934 |
72, Belvedere Road, London E10 7NP

| Today | See what it's worth now |
| 23 Jan 2026 | £770,000 |
| 8 Jul 2004 | £235,000 |
29, Seymour Road, Leyton E10 7LZ
| Today | See what it's worth now |
| 16 Jan 2026 | £466,000 |
No other historical records.
23, Tallack Road, London E10 7JR
| Today | See what it's worth now |
| 16 Jan 2026 | £575,000 |
| 26 Feb 2004 | £224,995 |
15, Amberley Road, London E10 7ER
| Today | See what it's worth now |
| 15 Jan 2026 | £640,000 |
| 10 Feb 1999 | £92,000 |
70, Bevan Court, Tallack Road, London E10 7FR
| Today | See what it's worth now |
| 15 Jan 2026 | £420,000 |
| 25 Nov 2020 | £420,000 |
No other historical records.
97, Clementina Road, London E10 7LT
| Today | See what it's worth now |
| 9 Jan 2026 | £516,000 |
| 25 Nov 2016 | £408,000 |
120, Beck Square, London E10 7FY
| Today | See what it's worth now |
| 15 Dec 2025 | £485,000 |
| 13 Dec 2019 | £500,000 |
No other historical records.
167, Beck Square, London E10 7FZ

| Today | See what it's worth now |
| 15 Dec 2025 | £460,000 |
| 17 Sep 2020 | £487,425 |
No other historical records.
39, Radlix Road, London E10 7BD
| Today | See what it's worth now |
| 12 Dec 2025 | £633,000 |
| 18 Oct 2001 | £156,000 |
No other historical records.
Source Acknowledgement: © Crown copyright. England and Wales house price data is publicly available information produced by the HM Land Registry.This material was last updated on 15 May 2026. It covers the period from 1 January 1995 to 31 March 2026 and contains property transactions which have been registered during that period. Contains HM Land Registry data © Crown copyright and database right 2026. This data is licensed under the Open Government Licence v3.0.
Disclaimer: Rightmove.co.uk provides this HM Land Registry data "as is". The burden for fitness of the data relies completely with the user and is provided for informational purposes only. No warranty, express or implied, is given relating to the accuracy of content of the HM Land Registry data and Rightmove does not accept any liability for error or omission. If you have found an error with the data or need further information please contact HM Land Registry.
Permitted Use: Viewers of this Information are granted permission to access this Crown copyright material and to download it onto electronic, magnetic, optical or similar storage media provided that such activities are for private research, study or in-house use only. Any other use of the material requires the formal written permission of Land Registry which can be requested from us, and is subject to an additional licence and associated charge.
Rightmove takes no liability for your use of, or reliance on, Rightmove's Instant Valuation due to the limitations of our tracking tool listed here. Use of this tool is taken entirely at your own risk. All rights reserved.