
House Prices in Lunsford's Cross
House prices in Lunsford's Cross have an overall average of £315,138 over the last year.
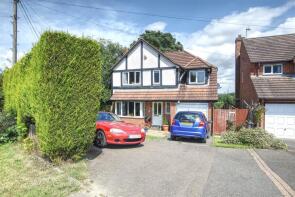
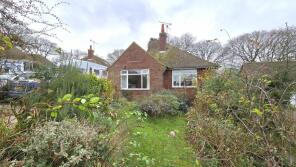
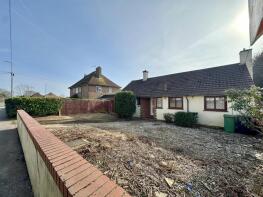
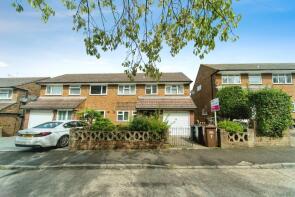
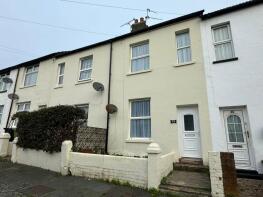
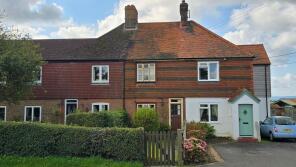
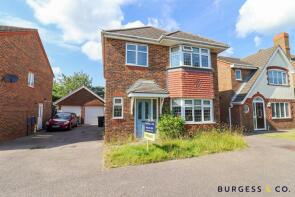
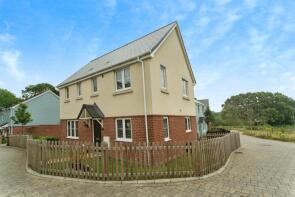
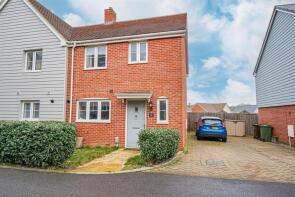
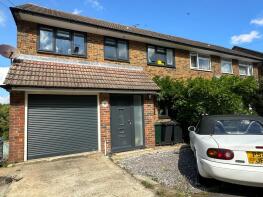
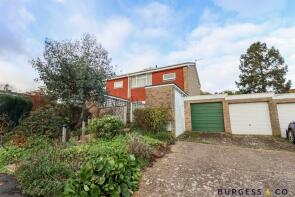
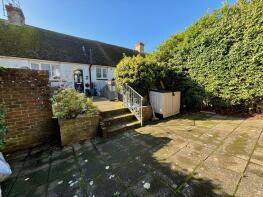
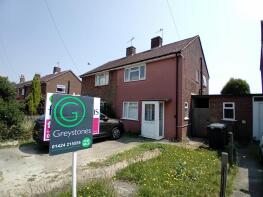
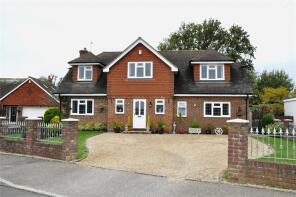
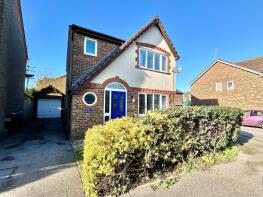
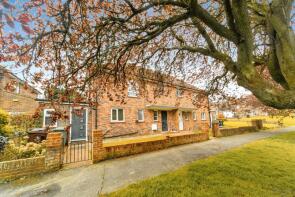
The majority of properties sold in Lunsford's Cross during the last year were detached properties, selling for an average price of £406,905. Semi-detached properties sold for an average of £301,361, with terraced properties fetching £238,583.
Overall, the historical sold prices in Lunsford's Cross over the last year were 1% up on the previous year and 2% down on the 2022 peak of £322,183.
Properties Sold
192a, Ninfield Road, Bexhill-on-sea TN39 5DA
| Today | See what it's worth now |
| 24 Jun 2025 | £390,000 |
| 28 Mar 2012 | £275,000 |
9, Highlands Close, Bexhill-on-sea TN39 5HP
| Today | See what it's worth now |
| 6 Jun 2025 | £288,000 |
| 15 Oct 2010 | £210,000 |
No other historical records.
55, Turkey Road, Bexhill-on-sea TN39 5HB
| Today | See what it's worth now |
| 30 May 2025 | £300,000 |
| 21 Aug 2015 | £220,000 |
5, Norfolk Close, Bexhill TN39 5BT
| Today | See what it's worth now |
| 23 May 2025 | £278,000 |
No other historical records.
48, Camperdown Street, Bexhill-on-sea TN39 5BE
| Today | See what it's worth now |
| 2 May 2025 | £210,000 |
| 25 Jan 2008 | £87,139 |
2, Thorne Farm Cottages, Ninfield Road, Ninfield, Bexhill TN39 5JP
| Today | See what it's worth now |
| 25 Apr 2025 | £185,000 |
No other historical records.
22, Hazel Grove, Bexhill-on-sea TN39 5JW
| Today | See what it's worth now |
| 11 Apr 2025 | £355,000 |
| 12 Jan 2005 | £232,950 |
No other historical records.
44, Claremont Road, Bexhill-on-sea TN39 5BX

| Today | See what it's worth now |
| 31 Mar 2025 | £230,000 |
| 27 Apr 2018 | £185,000 |
69, Watergate, Bexhill-on-sea TN39 5ED
| Today | See what it's worth now |
| 31 Mar 2025 | £339,000 |
| 27 Jan 2023 | £355,000 |
3, Langley Close, Bexhill-on-sea TN39 5EH
| Today | See what it's worth now |
| 31 Mar 2025 | £265,000 |
| 22 Jan 2015 | £160,000 |
5, Teachers House, Scholars Walk, Bexhill-on-sea TN39 5GB
| Today | See what it's worth now |
| 28 Mar 2025 | £167,500 |
| 9 Feb 2007 | £125,000 |
5, Scholars Walk, Bexhill-on-sea TN39 5GA


| Today | See what it's worth now |
| 28 Mar 2025 | £225,000 |
| 11 Apr 2007 | £245,000 |
No other historical records.
4, Teachers House, Scholars Walk, Bexhill-on-sea TN39 5GB
| Today | See what it's worth now |
| 28 Mar 2025 | £147,500 |
| 18 Aug 2017 | £115,000 |
39, Preston Road, Bexhill-on-sea TN39 5BN
| Today | See what it's worth now |
| 28 Mar 2025 | £273,000 |
| 30 Jul 2013 | £134,000 |
No other historical records.
18, Redgrove Close, Bexhill-on-sea TN39 5FD
| Today | See what it's worth now |
| 27 Mar 2025 | £325,000 |
| 30 Oct 2020 | £280,950 |
No other historical records.
8, Norfolk Close, Bexhill-on-sea TN39 5BT
| Today | See what it's worth now |
| 21 Mar 2025 | £345,000 |
| 24 Aug 2017 | £175,000 |
No other historical records.
19, Faygate Close, Bexhill TN39 5EE
| Today | See what it's worth now |
| 13 Mar 2025 | £240,000 |
No other historical records.
29, Claremont Road, Bexhill-on-sea TN39 5BX
| Today | See what it's worth now |
| 5 Mar 2025 | £183,000 |
| 11 Jun 2021 | £153,000 |
32, Paton Road, Bexhill-on-sea TN39 5DJ
| Today | See what it's worth now |
| 21 Feb 2025 | £245,500 |
| 28 Aug 2020 | £193,500 |
12, Thorne Crescent, Bexhill-on-sea TN39 5JH
| Today | See what it's worth now |
| 14 Feb 2025 | £720,000 |
| 15 Jul 2016 | £540,000 |
17, Alder Gardens, Bexhill-on-sea TN39 5JY
| Today | See what it's worth now |
| 7 Feb 2025 | £355,000 |
| 25 Jan 2013 | £225,000 |
17, Ingrams Avenue, Bexhill TN39 5AT
| Today | See what it's worth now |
| 31 Jan 2025 | £330,000 |
No other historical records.
39, Jubilee Road, Bexhill TN39 5DR
| Today | See what it's worth now |
| 31 Jan 2025 | £220,000 |
No other historical records.
9, Crowhurst Lane, Bexhill-on-sea TN39 5AS
| Today | See what it's worth now |
| 24 Jan 2025 | £285,000 |
| 16 Sep 2008 | £125,000 |
No other historical records.
27, Carfax Close, Bexhill TN39 5EG
| Today | See what it's worth now |
| 20 Dec 2024 | £253,000 |
No other historical records.
Get ready with a Mortgage in Principle
- Personalised result in just 20 minutes
- Find out how much you can borrow
- Get viewings faster with agents
- No impact on your credit score
What's your property worth?
Source Acknowledgement: © Crown copyright. England and Wales house price data is publicly available information produced by the HM Land Registry.This material was last updated on 6 August 2025. It covers the period from 1 January 1995 to 30 June 2025 and contains property transactions which have been registered during that period. Contains HM Land Registry data © Crown copyright and database right 2025. This data is licensed under the Open Government Licence v3.0.
Disclaimer: Rightmove.co.uk provides this HM Land Registry data "as is". The burden for fitness of the data relies completely with the user and is provided for informational purposes only. No warranty, express or implied, is given relating to the accuracy of content of the HM Land Registry data and Rightmove does not accept any liability for error or omission. If you have found an error with the data or need further information please contact HM Land Registry.
Permitted Use: Viewers of this Information are granted permission to access this Crown copyright material and to download it onto electronic, magnetic, optical or similar storage media provided that such activities are for private research, study or in-house use only. Any other use of the material requires the formal written permission of Land Registry which can be requested from us, and is subject to an additional licence and associated charge.
Map data ©OpenStreetMap contributors.
Rightmove takes no liability for your use of, or reliance on, Rightmove's Instant Valuation due to the limitations of our tracking tool listed here. Use of this tool is taken entirely at your own risk. All rights reserved.