
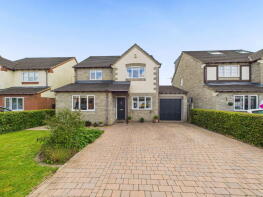
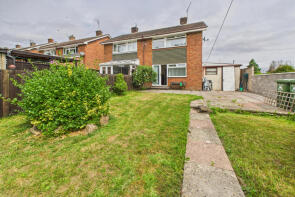
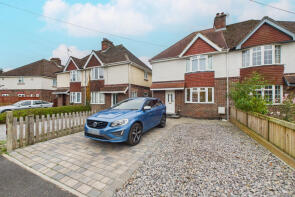
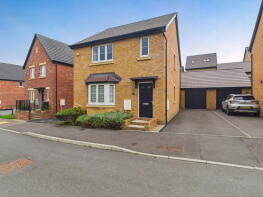
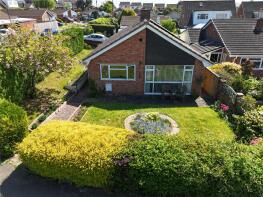
House Prices in Lydney
House prices in Lydney have an overall average of £264,229 over the last year.
The majority of properties sold in Lydney during the last year were semi-detached properties, selling for an average price of £244,071. Detached properties sold for an average of £329,160, with terraced properties fetching £209,511.
Overall, the historical sold prices in Lydney over the last year were 5% up on the previous year and 4% down on the 2022 peak of £275,661.
Properties Sold
48, Templeway West, Lydney GL15 5JD
| Today | See what it's worth now |
| 24 Apr 2026 | £415,000 |
| 30 Sep 2021 | £360,000 |
No other historical records.
138, Lakeside Avenue, Lydney GL15 5QB
| Today | See what it's worth now |
| 17 Apr 2026 | £240,000 |
| 8 Mar 2007 | £155,000 |
No other historical records.
12, Lynwood Road, Lydney GL15 5SG
| Today | See what it's worth now |
| 16 Apr 2026 | £310,000 |
| 17 Nov 2021 | £265,500 |
No other historical records.
20, Kings Meadow Court, Lydney GL15 5JU

| Today | See what it's worth now |
| 16 Apr 2026 | £160,000 |
| 30 Sep 2011 | £180,950 |
No other historical records.
3, Fairfield Road, Lydney GL15 5RT

| Today | See what it's worth now |
| 14 Apr 2026 | £160,000 |
| 18 Jan 2019 | £195,000 |
19, Barnett Way, Lydney GL15 5FS
| Today | See what it's worth now |
| 30 Mar 2026 | £237,500 |
| 12 Oct 2018 | £199,995 |
No other historical records.
11, Chantry Close, Lydney GL15 5TH
| Today | See what it's worth now |
| 20 Mar 2026 | £420,000 |
| 20 Jan 2016 | £285,000 |
12, Church Road, Lydney GL15 5ED
| Today | See what it's worth now |
| 12 Mar 2026 | £273,000 |
| 5 Jul 2005 | £184,000 |
No other historical records.
15, Edwin Jones Way, Lydney GL15 5FL
| Today | See what it's worth now |
| 10 Mar 2026 | £388,000 |
| 4 Oct 2019 | £317,995 |
No other historical records.
51, Church Road, Lydney GL15 5EH
| Today | See what it's worth now |
| 27 Feb 2026 | £180,000 |
| 19 Jan 2001 | £55,000 |
48, Mount Pleasant, Lydney GL15 5QF
| Today | See what it's worth now |
| 27 Feb 2026 | £200,000 |
| 20 Jun 2023 | £162,000 |
51, Primrose Hill, Lydney GL15 5SF
| Today | See what it's worth now |
| 27 Feb 2026 | £225,000 |
| 31 Mar 2020 | £160,000 |
9, Livia Way, Lydney GL15 5NU
| Today | See what it's worth now |
| 27 Feb 2026 | £175,000 |
| 25 Feb 2014 | £123,000 |
65, Lakeside Avenue, Lydney GL15 5QA
| Today | See what it's worth now |
| 27 Feb 2026 | £240,000 |
| 25 Aug 1995 | £42,000 |
No other historical records.
24, Lakeside Avenue, Lydney GL15 5PY
| Today | See what it's worth now |
| 26 Feb 2026 | £220,000 |
No other historical records.
30, Oxford Street, Lydney GL15 5DJ
| Today | See what it's worth now |
| 26 Feb 2026 | £320,000 |
| 30 Jul 1999 | £50,000 |
No other historical records.
25, Barnett Way, Lydney GL15 5FS
| Today | See what it's worth now |
| 20 Feb 2026 | £310,000 |
| 25 Sep 2020 | £259,995 |
No other historical records.
63, Lancaster Drive, Lydney GL15 5SJ
| Today | See what it's worth now |
| 19 Feb 2026 | £243,000 |
| 17 Nov 2023 | £242,500 |
25, Kimberley Drive, Lydney GL15 5AD

| Today | See what it's worth now |
| 13 Feb 2026 | £312,000 |
| 25 Sep 2015 | £157,500 |
No other historical records.
20, Ash Close, Lydney GL15 5NE
| Today | See what it's worth now |
| 10 Feb 2026 | £242,000 |
| 19 May 2017 | £170,000 |
No other historical records.
4, Tutnalls Street, Lydney GL15 5PF
| Today | See what it's worth now |
| 9 Feb 2026 | £337,500 |
| 8 Mar 2023 | £235,000 |
No other historical records.
38, Albert Street, Lydney GL15 5LX
| Today | See what it's worth now |
| 6 Feb 2026 | £232,500 |
| 25 Aug 2021 | £219,000 |
No other historical records.
80, Lancaster Drive, Lydney GL15 5SL
| Today | See what it's worth now |
| 6 Feb 2026 | £235,000 |
| 2 Jun 2009 | £142,000 |
No other historical records.
Source Acknowledgement: © Crown copyright. England and Wales house price data is publicly available information produced by the HM Land Registry.This material was last updated on 9 July 2026. It covers the period from 1 January 1995 to 30 April 2026 and contains property transactions which have been registered during that period. Contains HM Land Registry data © Crown copyright and database right 2026. This data is licensed under the Open Government Licence v3.0.
Disclaimer: Rightmove.co.uk provides this HM Land Registry data "as is". The burden for fitness of the data relies completely with the user and is provided for informational purposes only. No warranty, express or implied, is given relating to the accuracy of content of the HM Land Registry data and Rightmove does not accept any liability for error or omission. If you have found an error with the data or need further information please contact HM Land Registry.
Permitted Use: Viewers of this Information are granted permission to access this Crown copyright material and to download it onto electronic, magnetic, optical or similar storage media provided that such activities are for private research, study or in-house use only. Any other use of the material requires the formal written permission of Land Registry which can be requested from us, and is subject to an additional licence and associated charge.
Rightmove takes no liability for your use of, or reliance on, Rightmove's Instant Valuation due to the limitations of our tracking tool listed here. Use of this tool is taken entirely at your own risk. All rights reserved.