
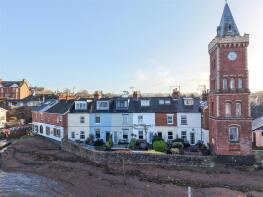
House Prices in Lympstone
House prices in Lympstone have an overall average of £610,556 over the last year.
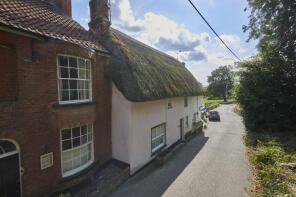
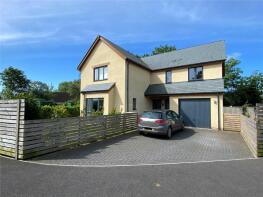
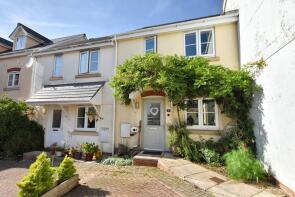
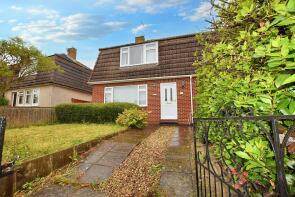
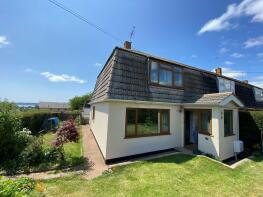
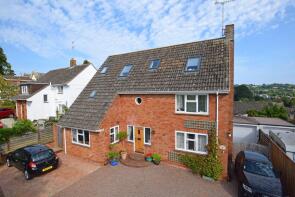
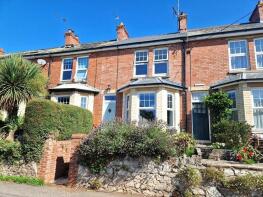
The majority of properties sold in Lympstone during the last year were detached properties, selling for an average price of £663,750. Terraced properties sold for an average of £561,250, with semi-detached properties fetching £595,000.
Overall, the historical sold prices in Lympstone over the last year were 24% up on the previous year and 12% down on the 2023 peak of £693,230.
Properties Sold
5, Harefield Cottages, The Strand, Exmouth EX8 5EX
| Today | See what it's worth now |
| 5 Dec 2025 | £825,000 |
| 13 Sep 2012 | £380,000 |
No other historical records.
4, Barnridge, Longmeadow Road, Exmouth EX8 5LG

| Today | See what it's worth now |
| 5 Sep 2025 | £405,000 |
| 29 Oct 2012 | £275,000 |
Byfield, Longmeadow Road, Lympstone EX8 5LE

| Today | See what it's worth now |
| 1 Sep 2025 | £620,000 |
No other historical records.
32, Underhill Crescent, Lympstone EX8 5JF
| Today | See what it's worth now |
| 21 Aug 2025 | £570,000 |
No other historical records.
10, Underhill Crescent, Lympstone EX8 5JF
| Today | See what it's worth now |
| 18 Aug 2025 | £595,000 |
No other historical records.
Alfayda, Underhill, Exmouth EX8 5HH
| Today | See what it's worth now |
| 12 Jun 2025 | £675,000 |
| 6 Mar 2001 | £195,000 |
No other historical records.
Town Dairy Cottage, Church Road, Exmouth EX8 5JU
| Today | See what it's worth now |
| 12 Mar 2025 | £590,000 |
| 10 Feb 2023 | £545,000 |
1, Gulliford Close, Lympstone EX8 5DG
| Today | See what it's worth now |
| 12 Mar 2025 | £790,000 |
| 9 Dec 2020 | £580,000 |
No other historical records.
Mitchells, The Strand, Exmouth EX8 5JW

| Today | See what it's worth now |
| 6 Mar 2025 | £425,000 |
| 8 Aug 2019 | £220,000 |
No other historical records.
5, Jackson Meadow, Lympstone, Exmouth EX8 5GZ
| Today | See what it's worth now |
| 28 Feb 2025 | £150,000 |
| 16 Feb 2024 | £150,000 |
No other historical records.
35, Gibraltar Road, Lympstone EX8 5HZ
| Today | See what it's worth now |
| 20 Jan 2025 | £235,000 |
No other historical records.
Meadowside, Longmeadow Road, Exmouth EX8 5LF

| Today | See what it's worth now |
| 20 Dec 2024 | £650,000 |
| 25 Mar 1995 | £95,500 |
No other historical records.
Dewdneys Orchard, Church Path Terrace, Lympstone EX8 5HJ
| Today | See what it's worth now |
| 18 Dec 2024 | £565,000 |
No other historical records.
Rose Cottage, Longmeadow Road, Exmouth EX8 5LE
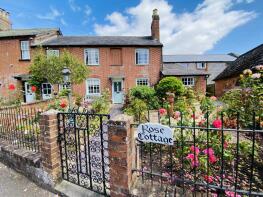
| Today | See what it's worth now |
| 16 Dec 2024 | £475,000 |
| 9 Jul 2001 | £147,375 |
No other historical records.
Wedgewood, Underhill, Exmouth EX8 5HH
| Today | See what it's worth now |
| 12 Dec 2024 | £560,000 |
| 9 Sep 2022 | £595,000 |
1a, The Strand, Lympstone EX8 5JW

| Today | See what it's worth now |
| 9 Dec 2024 | £185,000 |
No other historical records.
4, Strawberry Hill, Lympstone EX8 5JZ


| Today | See what it's worth now |
| 17 Oct 2024 | £975,000 |
No other historical records.
Osborne House, The Strand, Lympstone EX8 5JS

| Today | See what it's worth now |
| 1 Oct 2024 | £700,000 |
No other historical records.
1, Stafford Cottages, Sowden Lane, Lympstone EX8 5HB

| Today | See what it's worth now |
| 22 Aug 2024 | £350,000 |
No other historical records.
1, Haynes Cottages, Lympstone, Exmouth EX8 5LX
| Today | See what it's worth now |
| 14 Aug 2024 | £254,000 |
| 9 Oct 2020 | £197,500 |
1, Glebe Close, Exmouth EX8 5JA
| Today | See what it's worth now |
| 25 Jul 2024 | £325,000 |
| 30 Sep 2015 | £186,000 |
13 Strawberry Hill Cottage, Strawberry Hill, Exmouth EX8 5JZ
| Today | See what it's worth now |
| 2 May 2024 | £850,000 |
| 16 Nov 2007 | £445,000 |
15, Birch Road, Lympstone EX8 5LB

| Today | See what it's worth now |
| 2 May 2024 | £675,000 |
No other historical records.
9, Malt Field, Exmouth EX8 5ND

| Today | See what it's worth now |
| 2 May 2024 | £880,000 |
| 25 May 2012 | £500,000 |
2, Barnridge, Longmeadow Road, Exmouth EX8 5LG
| Today | See what it's worth now |
| 2 May 2024 | £442,500 |
| 30 Mar 2020 | £355,000 |
Source Acknowledgement: © Crown copyright. England and Wales house price data is publicly available information produced by the HM Land Registry.This material was last updated on 4 February 2026. It covers the period from 1 January 1995 to 24 December 2025 and contains property transactions which have been registered during that period. Contains HM Land Registry data © Crown copyright and database right 2026. This data is licensed under the Open Government Licence v3.0.
Disclaimer: Rightmove.co.uk provides this HM Land Registry data "as is". The burden for fitness of the data relies completely with the user and is provided for informational purposes only. No warranty, express or implied, is given relating to the accuracy of content of the HM Land Registry data and Rightmove does not accept any liability for error or omission. If you have found an error with the data or need further information please contact HM Land Registry.
Permitted Use: Viewers of this Information are granted permission to access this Crown copyright material and to download it onto electronic, magnetic, optical or similar storage media provided that such activities are for private research, study or in-house use only. Any other use of the material requires the formal written permission of Land Registry which can be requested from us, and is subject to an additional licence and associated charge.
Map data ©OpenStreetMap contributors.
Rightmove takes no liability for your use of, or reliance on, Rightmove's Instant Valuation due to the limitations of our tracking tool listed here. Use of this tool is taken entirely at your own risk. All rights reserved.