
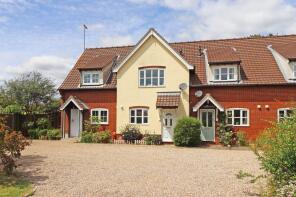
House Prices in Manningtree
House prices in Manningtree have an overall average of £362,230 over the last year.
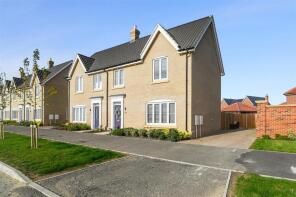
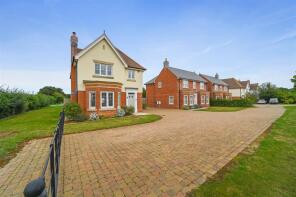
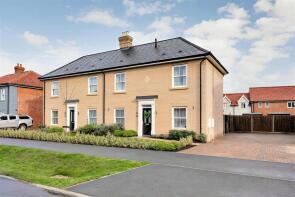
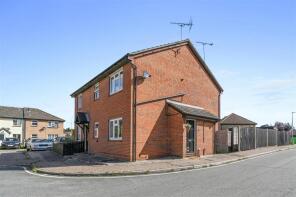
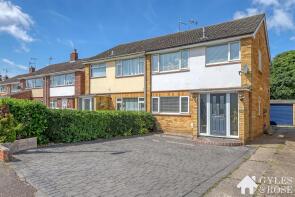
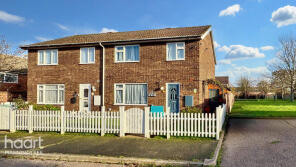
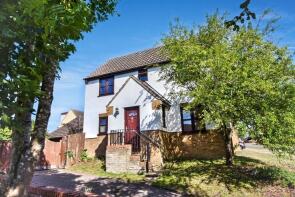
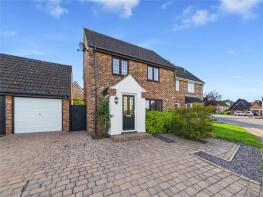
The majority of properties sold in Manningtree during the last year were detached properties, selling for an average price of £493,200. Semi-detached properties sold for an average of £316,559, with terraced properties fetching £282,231.
Overall, the historical sold prices in Manningtree over the last year were 8% down on the previous year and 10% down on the 2023 peak of £404,528.
Properties Sold
27, Nash Close, Manningtree CO11 2LE

| Today | See what it's worth now |
| 20 Apr 2026 | £250,000 |
| 20 Feb 2015 | £162,000 |
123, The Avenue, Lawford CO11 2FR
| Today | See what it's worth now |
| 17 Apr 2026 | £344,000 |
| 11 Oct 2024 | £335,000 |
No other historical records.
97, Harwich Road, Manningtree CO11 1NA
| Today | See what it's worth now |
| 17 Apr 2026 | £525,000 |
| 12 Oct 2018 | £415,000 |
No other historical records.
10, William Way, Manningtree CO11 2GE
| Today | See what it's worth now |
| 17 Apr 2026 | £328,000 |
| 22 Feb 2023 | £315,000 |
No other historical records.
14, Nash Close, Manningtree CO11 2LE
| Today | See what it's worth now |
| 13 Apr 2026 | £193,500 |
| 16 Mar 2022 | £167,000 |
2, Elizabeth Cottages, East End Lane, Colchester CO7 6XQ
| Today | See what it's worth now |
| 9 Apr 2026 | £240,000 |
| 29 May 2009 | £143,000 |
17, Hunter Drive, Manningtree CO11 2EJ
| Today | See what it's worth now |
| 2 Apr 2026 | £360,000 |
| 23 Apr 2021 | £314,000 |
25, Westmorland Close, Manningtree CO11 1LY
| Today | See what it's worth now |
| 27 Mar 2026 | £291,000 |
| 12 Sep 1997 | £45,500 |
No other historical records.
Barley Cottage, The Street, Manningtree CO11 2US
| Today | See what it's worth now |
| 23 Mar 2026 | £260,000 |
| 4 Dec 2018 | £263,000 |
24, Swan Court, Manningtree CO11 1LN
| Today | See what it's worth now |
| 20 Mar 2026 | £77,500 |
| 5 Sep 2013 | £99,000 |
50, Temple Pattle, Manningtree CO11 1RW

| Today | See what it's worth now |
| 16 Mar 2026 | £245,000 |
| 31 Mar 2023 | £242,000 |
47a, Maltings Wharf, Manningtree CO11 1XE
| Today | See what it's worth now |
| 13 Mar 2026 | £260,000 |
| 17 Jun 2016 | £247,500 |
Flat 4, Secret Bunker, Shrubland Road, Manningtree CO11 1HS

| Today | See what it's worth now |
| 4 Mar 2026 | £305,000 |
| 13 Sep 2021 | £275,000 |
No other historical records.
1, Keating Close, Manningtree CO11 2HF
| Today | See what it's worth now |
| 2 Mar 2026 | £240,000 |
| 9 Aug 2024 | £252,500 |
8, Rigby Avenue, Manningtree CO11 2DH
| Today | See what it's worth now |
| 27 Feb 2026 | £292,000 |
| 27 Jun 2008 | £148,000 |
2, Seafield Avenue, Manningtree CO11 1UE
| Today | See what it's worth now |
| 27 Feb 2026 | £310,000 |
| 24 Sep 1999 | £69,950 |
No other historical records.
Lavandou, Steam Mill Road, Bradfield CO11 2QT
| Today | See what it's worth now |
| 27 Feb 2026 | £400,000 |
No other historical records.
Alicea Cottage, Steam Mill Road, Manningtree CO11 2QX

| Today | See what it's worth now |
| 27 Feb 2026 | £615,000 |
| 22 Mar 2005 | £305,000 |
No other historical records.
24, School Lane, Lawford CO11 2HZ
| Today | See what it's worth now |
| 23 Feb 2026 | £347,500 |
No other historical records.
Apartment 13, The New Barley Store, High Street, Manningtree CO11 1AR
| Today | See what it's worth now |
| 20 Feb 2026 | £222,500 |
| 27 Jun 2008 | £160,000 |
11, Taylor Drive, Manningtree CO11 2HU

| Today | See what it's worth now |
| 18 Feb 2026 | £370,000 |
| 30 Aug 2018 | £285,000 |
38, Cotman Avenue, Manningtree CO11 2HB
| Today | See what it's worth now |
| 13 Feb 2026 | £395,000 |
| 9 Jun 2000 | £115,000 |
No other historical records.
18, Turner Avenue, Manningtree CO11 2LG
| Today | See what it's worth now |
| 11 Feb 2026 | £295,000 |
| 21 Jun 2002 | £106,500 |
Source Acknowledgement: © Crown copyright. England and Wales house price data is publicly available information produced by the HM Land Registry.This material was last updated on 9 July 2026. It covers the period from 1 January 1995 to 30 April 2026 and contains property transactions which have been registered during that period. Contains HM Land Registry data © Crown copyright and database right 2026. This data is licensed under the Open Government Licence v3.0.
Disclaimer: Rightmove.co.uk provides this HM Land Registry data "as is". The burden for fitness of the data relies completely with the user and is provided for informational purposes only. No warranty, express or implied, is given relating to the accuracy of content of the HM Land Registry data and Rightmove does not accept any liability for error or omission. If you have found an error with the data or need further information please contact HM Land Registry.
Permitted Use: Viewers of this Information are granted permission to access this Crown copyright material and to download it onto electronic, magnetic, optical or similar storage media provided that such activities are for private research, study or in-house use only. Any other use of the material requires the formal written permission of Land Registry which can be requested from us, and is subject to an additional licence and associated charge.
Rightmove takes no liability for your use of, or reliance on, Rightmove's Instant Valuation due to the limitations of our tracking tool listed here. Use of this tool is taken entirely at your own risk. All rights reserved.