
House Prices in Mapperley Plains
House prices in Mapperley Plains have an overall average of £325,187 over the last year.
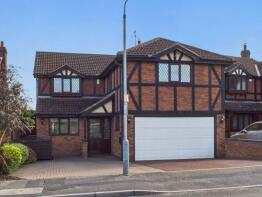
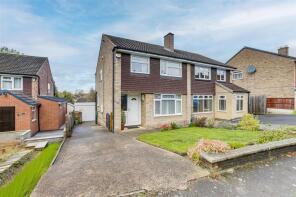
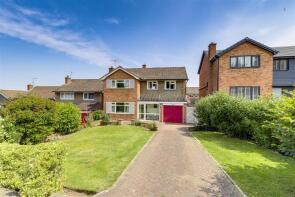
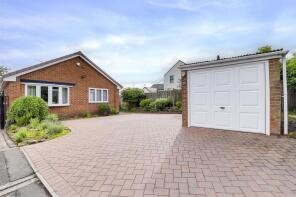
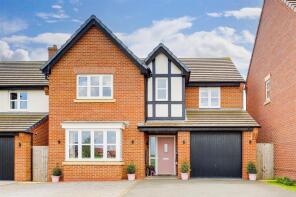
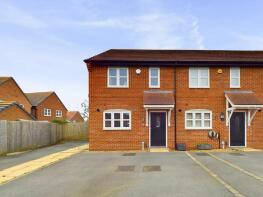
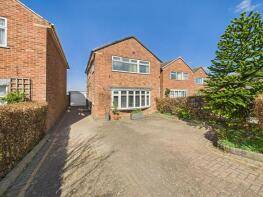
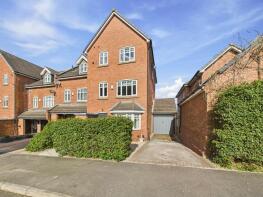
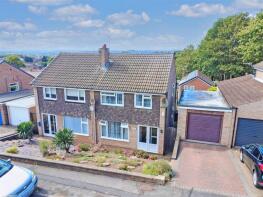
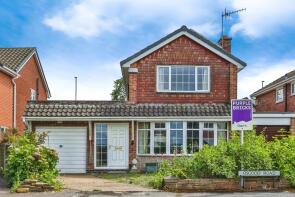
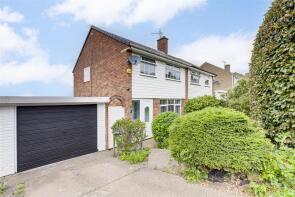
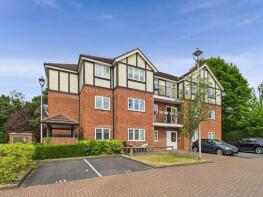
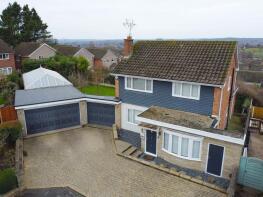
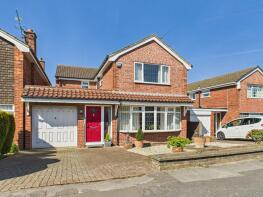
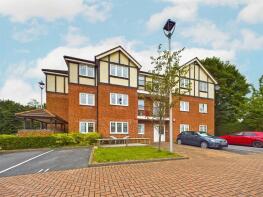
The majority of properties sold in Mapperley Plains during the last year were detached properties, selling for an average price of £429,559. Semi-detached properties sold for an average of £274,934, with terraced properties fetching £222,190.
Overall, the historical sold prices in Mapperley Plains over the last year were 8% up on the previous year and 2% down on the 2021 peak of £331,504.
Properties Sold
33, Chedington Avenue, Nottingham NG3 5SG
| Today | See what it's worth now |
| 7 Apr 2026 | £475,000 |
| 23 Nov 2012 | £270,000 |
9, Axmouth Drive, Nottingham NG3 5SX
| Today | See what it's worth now |
| 6 Mar 2026 | £370,000 |
| 15 Dec 2021 | £340,000 |
No other historical records.
14, Connelly Close, Arnold NG5 6RA
| Today | See what it's worth now |
| 27 Feb 2026 | £245,270 |
No other historical records.
4, Appleton Gardens, Plains Road, Nottingham NG3 5NT
| Today | See what it's worth now |
| 23 Feb 2026 | £157,000 |
| 2 May 2008 | £159,000 |
No other historical records.
419, Gedling Road, Arnold NG5 6PB
| Today | See what it's worth now |
| 18 Feb 2026 | £340,000 |
No other historical records.
25, Armfield Road, Nottingham NG5 6QY
| Today | See what it's worth now |
| 16 Feb 2026 | £314,000 |
| 3 Aug 2018 | £191,000 |
No other historical records.
58, Seaton Way, Nottingham NG3 5XB
| Today | See what it's worth now |
| 4 Feb 2026 | £440,000 |
| 29 Mar 2018 | £359,950 |
No other historical records.
34, Shaldon Close, Nottingham NG3 5XF
| Today | See what it's worth now |
| 4 Feb 2026 | £170,333 |
| 26 Feb 2019 | £133,000 |
No other historical records.
37, Stiles Road, Nottingham NG5 6RE
| Today | See what it's worth now |
| 26 Jan 2026 | £325,000 |
| 27 Sep 2002 | £132,000 |
No other historical records.
6, Linden Place, Nottingham NG3 5RB
| Today | See what it's worth now |
| 19 Dec 2025 | £360,000 |
| 5 Apr 2002 | £189,950 |
No other historical records.
25, Peters Close, Arnold NG5 6RD
| Today | See what it's worth now |
| 19 Dec 2025 | £225,000 |
No other historical records.
4, Denbury Court, Nottingham NG3 5TD
| Today | See what it's worth now |
| 18 Dec 2025 | £245,000 |
| 6 Nov 2020 | £197,000 |
17, Osgood Road, Arnold NG5 6RF
| Today | See what it's worth now |
| 16 Dec 2025 | £255,000 |
No other historical records.
11, Stiles Road, Nottingham NG5 6RE
| Today | See what it's worth now |
| 12 Dec 2025 | £256,000 |
| 30 Nov 2018 | £176,000 |
9, Clementine Drive, Nottingham NG3 5UX

| Today | See what it's worth now |
| 12 Dec 2025 | £250,000 |
| 17 Jul 2013 | £175,000 |
No other historical records.
15, Appleton Gardens, Plains Road, Nottingham NG3 5NT
| Today | See what it's worth now |
| 26 Nov 2025 | £158,000 |
| 29 Mar 2019 | £145,000 |
8, Byrne Court, Nottingham NG5 6RN
| Today | See what it's worth now |
| 18 Nov 2025 | £450,000 |
| 4 Sep 2020 | £351,000 |
5, Ashwater Drive, Mapperley NG3 5SJ

| Today | See what it's worth now |
| 6 Nov 2025 | £360,000 |
No other historical records.
14, Osgood Road, Arnold NG5 6RF
| Today | See what it's worth now |
| 31 Oct 2025 | £380,000 |
No other historical records.
18, Appleton Gardens, Plains Road, Nottingham NG3 5NT
| Today | See what it's worth now |
| 30 Oct 2025 | £160,000 |
| 1 Mar 2019 | £142,500 |
10, Tambling Close, Nottingham NG5 6RB
| Today | See what it's worth now |
| 29 Oct 2025 | £233,000 |
| 25 Nov 2019 | £185,000 |
10, Wembley Road, Nottingham NG5 6RP
| Today | See what it's worth now |
| 24 Oct 2025 | £240,000 |
| 21 Nov 2014 | £142,000 |
26, Stiles Road, Nottingham NG5 6RE
| Today | See what it's worth now |
| 15 Oct 2025 | £280,000 |
| 15 Jun 2018 | £190,000 |
Source Acknowledgement: © Crown copyright. England and Wales house price data is publicly available information produced by the HM Land Registry.This material was last updated on 9 July 2026. It covers the period from 1 January 1995 to 30 April 2026 and contains property transactions which have been registered during that period. Contains HM Land Registry data © Crown copyright and database right 2026. This data is licensed under the Open Government Licence v3.0.
Disclaimer: Rightmove.co.uk provides this HM Land Registry data "as is". The burden for fitness of the data relies completely with the user and is provided for informational purposes only. No warranty, express or implied, is given relating to the accuracy of content of the HM Land Registry data and Rightmove does not accept any liability for error or omission. If you have found an error with the data or need further information please contact HM Land Registry.
Permitted Use: Viewers of this Information are granted permission to access this Crown copyright material and to download it onto electronic, magnetic, optical or similar storage media provided that such activities are for private research, study or in-house use only. Any other use of the material requires the formal written permission of Land Registry which can be requested from us, and is subject to an additional licence and associated charge.
Rightmove takes no liability for your use of, or reliance on, Rightmove's Instant Valuation due to the limitations of our tracking tool listed here. Use of this tool is taken entirely at your own risk. All rights reserved.