
House Prices in Marple Bridge
House prices in Marple Bridge have an overall average of £495,508 over the last year.
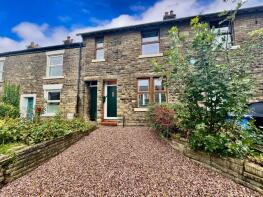
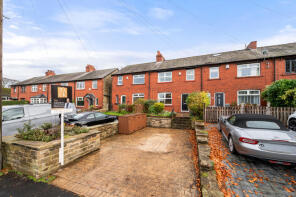
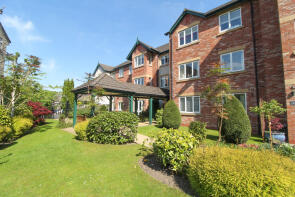
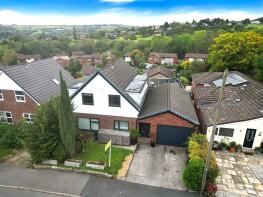
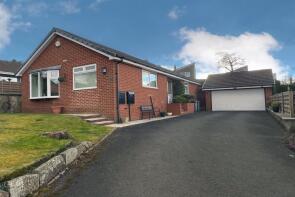
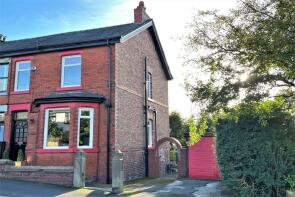
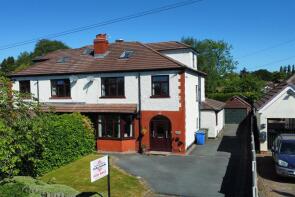
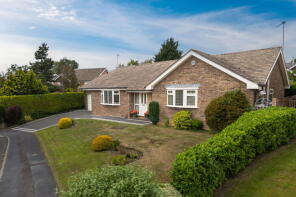
The majority of properties sold in Marple Bridge during the last year were detached properties, selling for an average price of £603,795. Semi-detached properties sold for an average of £482,938, with terraced properties fetching £293,812.
Overall, the historical sold prices in Marple Bridge over the last year were 2% up on the previous year and 7% up on the 2022 peak of £465,113.
Properties Sold
57, Constable Drive, Marple Bridge, Stockport SK6 5BG
| Today | See what it's worth now |
| 15 Apr 2026 | £580,000 |
| 8 Apr 2021 | £425,000 |
22, Leighton Drive, Marple Bridge, Stockport SK6 5BY
| Today | See what it's worth now |
| 10 Apr 2026 | £685,000 |
| 5 Jun 2015 | £350,000 |
No other historical records.
5, Lowry Drive, Marple Bridge, Stockport SK6 5BR
| Today | See what it's worth now |
| 10 Apr 2026 | £385,000 |
| 29 Jun 2001 | £155,000 |
48, Hollins Lane, Marple Bridge, Stockport SK6 5BD
| Today | See what it's worth now |
| 24 Mar 2026 | £892,650 |
| 17 Jan 2014 | £600,000 |
No other historical records.
140, Compstall Road, Marple Bridge, Stockport SK6 5HD
| Today | See what it's worth now |
| 24 Mar 2026 | £333,000 |
| 22 Jun 2021 | £245,000 |
34 Blossom Tree House, Compstall Road, Marple Bridge, Stockport SK6 5HG
| Today | See what it's worth now |
| 24 Mar 2026 | £332,500 |
| 18 Nov 2022 | £325,000 |
11, Riverside Court, Waters Edge, Marple Bridge, Stockport SK6 5EY
| Today | See what it's worth now |
| 13 Mar 2026 | £215,000 |
| 26 Jul 2002 | £157,900 |
55, Constable Drive, Marple Bridge, Stockport SK6 5BG
| Today | See what it's worth now |
| 5 Mar 2026 | £560,000 |
| 12 Jan 2015 | £267,000 |
No other historical records.
32, Ernocroft Road, Marple Bridge, Stockport SK6 5DY

| Today | See what it's worth now |
| 25 Feb 2026 | £330,000 |
No other historical records.
16, Highfield Road, Mellor, Stockport SK6 5AL
| Today | See what it's worth now |
| 19 Feb 2026 | £425,000 |
| 25 Jul 1997 | £84,000 |
No other historical records.
147, Compstall Road, Marple Bridge, Stockport SK6 5HA
| Today | See what it's worth now |
| 19 Feb 2026 | £355,000 |
| 23 Jan 2015 | £225,000 |
97, Longhurst Lane, Mellor, Stockport SK6 5PG
| Today | See what it's worth now |
| 11 Feb 2026 | £760,000 |
| 21 Jun 1996 | £150,000 |
No other historical records.
12, Hillside Grove, Marple Bridge, Stockport SK6 5EP

| Today | See what it's worth now |
| 30 Jan 2026 | £400,000 |
| 29 Jul 2020 | £287,000 |
The Oaks, Gird Lane, Marple Bridge, Stockport SK6 5LP
| Today | See what it's worth now |
| 30 Jan 2026 | £616,000 |
No other historical records.
10, Cote Green Lane, Marple Bridge, Stockport SK6 5DZ

| Today | See what it's worth now |
| 30 Jan 2026 | £380,000 |
| 3 Aug 2007 | £175,000 |
No other historical records.
23, Hollins Lane, Marple Bridge, Stockport SK6 5BD
| Today | See what it's worth now |
| 12 Jan 2026 | £650,000 |
No other historical records.
4, Bankside Close, Marple Bridge, Stockport SK6 5ET
| Today | See what it's worth now |
| 17 Dec 2025 | £500,000 |
| 13 Jan 2017 | £321,000 |
13, Lower Fold, Marple Bridge, Stockport SK6 5DX
| Today | See what it's worth now |
| 15 Dec 2025 | £436,000 |
| 20 Sep 2002 | £138,927 |
43, Compstall Road, Marple Bridge, Stockport SK6 5HG
| Today | See what it's worth now |
| 26 Nov 2025 | £262,500 |
| 2 Apr 2015 | £147,275 |
11, Homer Drive, Marple Bridge, Stockport SK6 5DR
| Today | See what it's worth now |
| 18 Nov 2025 | £438,000 |
| 2 Oct 2006 | £257,000 |
30, Cote Green Lane, Marple Bridge, Stockport SK6 5EB
| Today | See what it's worth now |
| 18 Nov 2025 | £382,000 |
No other historical records.
85, Hollins Lane, Marple Bridge, Stockport SK6 5DA
| Today | See what it's worth now |
| 14 Nov 2025 | £603,000 |
No other historical records.
37, Fernwood, Marple Bridge, Stockport SK6 5BE
| Today | See what it's worth now |
| 7 Nov 2025 | £635,000 |
| 22 May 2007 | £390,000 |
No other historical records.
Source Acknowledgement: © Crown copyright. England and Wales house price data is publicly available information produced by the HM Land Registry.This material was last updated on 9 July 2026. It covers the period from 1 January 1995 to 30 April 2026 and contains property transactions which have been registered during that period. Contains HM Land Registry data © Crown copyright and database right 2026. This data is licensed under the Open Government Licence v3.0.
Disclaimer: Rightmove.co.uk provides this HM Land Registry data "as is". The burden for fitness of the data relies completely with the user and is provided for informational purposes only. No warranty, express or implied, is given relating to the accuracy of content of the HM Land Registry data and Rightmove does not accept any liability for error or omission. If you have found an error with the data or need further information please contact HM Land Registry.
Permitted Use: Viewers of this Information are granted permission to access this Crown copyright material and to download it onto electronic, magnetic, optical or similar storage media provided that such activities are for private research, study or in-house use only. Any other use of the material requires the formal written permission of Land Registry which can be requested from us, and is subject to an additional licence and associated charge.
Rightmove takes no liability for your use of, or reliance on, Rightmove's Instant Valuation due to the limitations of our tracking tool listed here. Use of this tool is taken entirely at your own risk. All rights reserved.