
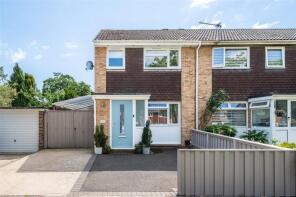
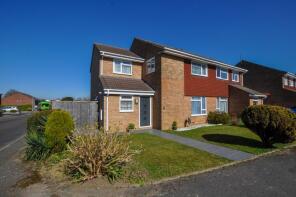
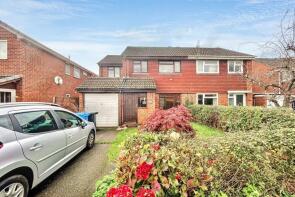
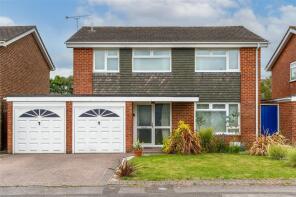
House Prices in Merley
House prices in Merley have an overall average of £492,062 over the last year.
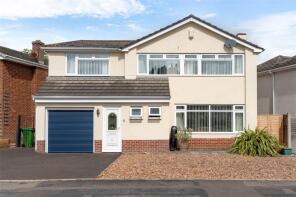
The majority of properties sold in Merley during the last year were detached properties, selling for an average price of £557,198. Semi-detached properties sold for an average of £344,167, with flats fetching £192,000.
Overall, the historical sold prices in Merley over the last year were 8% up on the previous year and 2% up on the 2023 peak of £480,492.
Properties Sold
6, Merley Gardens, Wimborne BH21 1TB
| Today | See what it's worth now |
| 13 Feb 2026 | £500,000 |
| 4 Apr 2007 | £314,000 |
No other historical records.
123, Merley Ways, Wimborne BH21 1QP
| Today | See what it's worth now |
| 12 Feb 2026 | £870,000 |
| 31 May 2018 | £460,000 |
No other historical records.
41, Gravel Hill, Poole BH21 1RW
| Today | See what it's worth now |
| 23 Jan 2026 | £475,000 |
No other historical records.
24, Oakley Lane, Wimborne BH21 3AB

| Today | See what it's worth now |
| 9 Jan 2026 | £330,000 |
| 8 Aug 2002 | £160,000 |
No other historical records.
19, Egdon Drive, Wimborne BH21 1TY
| Today | See what it's worth now |
| 17 Dec 2025 | £395,000 |
| 10 Mar 2017 | £345,000 |
No other historical records.
10, Countess Close, Wimborne BH21 1UJ
| Today | See what it's worth now |
| 16 Dec 2025 | £614,000 |
| 30 Jan 2025 | £600,000 |
1, Matilda Close, Wimborne BH21 1GQ
| Today | See what it's worth now |
| 12 Dec 2025 | £615,000 |
| 15 Sep 2016 | £550,000 |
No other historical records.
131, Merley Ways, Wimborne BH21 1QR
| Today | See what it's worth now |
| 5 Dec 2025 | £1,265,000 |
| 19 Mar 2021 | £759,000 |
No other historical records.
340, Sopwith Crescent, Wimborne BH21 1XF
| Today | See what it's worth now |
| 28 Nov 2025 | £310,000 |
| 25 Jan 2024 | £245,000 |
90, Rempstone Road, Wimborne BH21 1RP
| Today | See what it's worth now |
| 27 Nov 2025 | £510,000 |
| 30 Nov 2001 | £177,000 |
No other historical records.
93a, Cockerell Close, Wimborne BH21 1XR
| Today | See what it's worth now |
| 7 Nov 2025 | £224,000 |
| 31 Oct 2018 | £213,000 |
19, Harrier Drive, Wimborne BH21 1XE

| Today | See what it's worth now |
| 30 Oct 2025 | £455,000 |
| 27 Aug 2004 | £269,000 |
No other historical records.
97, Merley Lane, Wimborne BH21 3AZ
| Today | See what it's worth now |
| 30 Oct 2025 | £286,000 |
| 1 Nov 2019 | £235,000 |
6, Layard Drive, Wimborne BH21 1TF
| Today | See what it's worth now |
| 17 Oct 2025 | £373,000 |
| 16 Oct 2017 | £194,000 |
No other historical records.
3, Gravel Hill, Wimborne BH21 1RW

| Today | See what it's worth now |
| 14 Oct 2025 | £270,155 |
| 31 Jan 2018 | £795,000 |
No other historical records.
1, Cockerell Close, Poole BH21 1XP
| Today | See what it's worth now |
| 14 Oct 2025 | £347,500 |
| 4 Nov 2016 | £270,000 |
18, Cockerell Close, Wimborne BH21 1XT
| Today | See what it's worth now |
| 9 Oct 2025 | £422,500 |
| 16 Nov 2011 | £210,000 |
No other historical records.
137, Cockerell Close, Wimborne BH21 1XS
| Today | See what it's worth now |
| 19 Sep 2025 | £380,000 |
| 30 Aug 2002 | £158,000 |
No other historical records.
165, Sopwith Crescent, Wimborne BH21 1SR
| Today | See what it's worth now |
| 17 Sep 2025 | £525,000 |
| 21 Mar 2019 | £380,000 |
No other historical records.
59, Merley Ways, Poole BH21 1QW
| Today | See what it's worth now |
| 5 Sep 2025 | £425,000 |
No other historical records.
33, Merley Lane, Wimborne BH21 1RU


| Today | See what it's worth now |
| 5 Sep 2025 | £1,000,000 |
| 17 Oct 1997 | £410,000 |
No other historical records.
22, Mimosa Avenue, Poole BH21 1TT
| Today | See what it's worth now |
| 29 Aug 2025 | £447,500 |
No other historical records.
76, Merley Ways, Poole BH21 1QR
| Today | See what it's worth now |
| 15 Aug 2025 | £570,000 |
No other historical records.
12, Oakley Hill, Poole BH21 1QH
| Today | See what it's worth now |
| 8 Aug 2025 | £500,000 |
No other historical records.
23, Oakley Lane, Wimborne BH21 1SF
| Today | See what it's worth now |
| 30 Jul 2025 | £520,000 |
| 25 Oct 2022 | £495,000 |
Source Acknowledgement: © Crown copyright. England and Wales house price data is publicly available information produced by the HM Land Registry.This material was last updated on 9 April 2026. It covers the period from 1 January 1995 to 27 February 2026 and contains property transactions which have been registered during that period. Contains HM Land Registry data © Crown copyright and database right 2026. This data is licensed under the Open Government Licence v3.0.
Disclaimer: Rightmove.co.uk provides this HM Land Registry data "as is". The burden for fitness of the data relies completely with the user and is provided for informational purposes only. No warranty, express or implied, is given relating to the accuracy of content of the HM Land Registry data and Rightmove does not accept any liability for error or omission. If you have found an error with the data or need further information please contact HM Land Registry.
Permitted Use: Viewers of this Information are granted permission to access this Crown copyright material and to download it onto electronic, magnetic, optical or similar storage media provided that such activities are for private research, study or in-house use only. Any other use of the material requires the formal written permission of Land Registry which can be requested from us, and is subject to an additional licence and associated charge.
Map data ©OpenStreetMap contributors.
Rightmove takes no liability for your use of, or reliance on, Rightmove's Instant Valuation due to the limitations of our tracking tool listed here. Use of this tool is taken entirely at your own risk. All rights reserved.