
House Prices in Mickleover
House prices in Mickleover have an overall average of £307,671 over the last year.
The majority of properties sold in Mickleover during the last year were semi-detached properties, selling for an average price of £270,464. Detached properties sold for an average of £379,028, with terraced properties fetching £234,085.
Overall, the historical sold prices in Mickleover over the last year were 2% down on the previous year and 3% down on the 2023 peak of £316,012.
Properties Sold
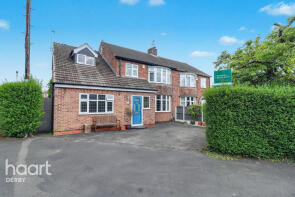
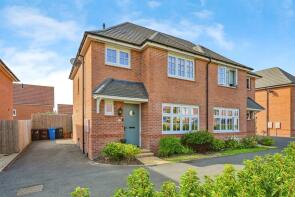
4, North Avenue, Mickleover, Derby DE3 9HY
| Today | See what it's worth now |
| 23 Apr 2026 | £385,000 |
| 29 Nov 2019 | £299,950 |
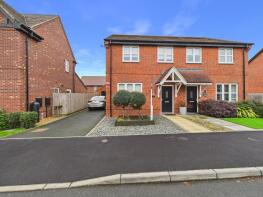
3, Statham Close, Mickleover, Derby DE3 0AH
| Today | See what it's worth now |
| 22 Apr 2026 | £280,000 |
| 29 Mar 2019 | £219,950 |
No other historical records.
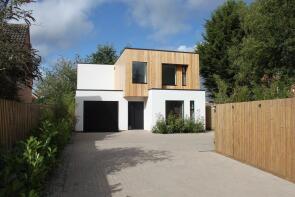
58a, Station Road, Mickleover, Derby DE3 9GJ
| Today | See what it's worth now |
| 16 Apr 2026 | £685,000 |
| 31 Mar 2016 | £245,000 |
No other historical records.
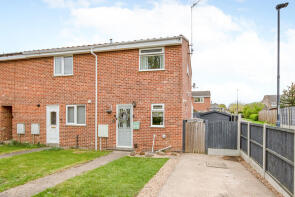
16, Banwell Close, Derby DE3 0QP
| Today | See what it's worth now |
| 10 Apr 2026 | £190,000 |
| 28 Jun 2005 | £117,000 |
9, Grandison Close, Derby DE22 4PA
| Today | See what it's worth now |
| 10 Apr 2026 | £255,000 |
| 20 Dec 2019 | £209,000 |
26, Roydon Close, Derby DE3 0PN
| Today | See what it's worth now |
| 9 Apr 2026 | £240,000 |
| 9 Aug 2004 | £179,950 |
No other historical records.
10, Cromer Close, Derby DE3 0TQ
| Today | See what it's worth now |
| 9 Apr 2026 | £195,000 |
| 11 Feb 2022 | £180,000 |
23, Staines Close, Derby DE3 0RL
| Today | See what it's worth now |
| 2 Apr 2026 | £310,000 |
| 6 Nov 2019 | £172,500 |
3, Chatsworth Drive, Derby DE3 9HF
| Today | See what it's worth now |
| 2 Apr 2026 | £225,000 |
| 23 Sep 2005 | £147,000 |
No other historical records.
1, Haddon Drive, Mickleover, Derby DE3 9HL
| Today | See what it's worth now |
| 1 Apr 2026 | £220,000 |
| 13 Sep 2019 | £139,272 |
8, Fennel Avenue, Derby DE3 0FS

| Today | See what it's worth now |
| 1 Apr 2026 | £438,000 |
| 29 Nov 2019 | £353,950 |
No other historical records.
5, Gooseberry Grove, Derby DE3 9NZ
| Today | See what it's worth now |
| 1 Apr 2026 | £292,500 |
| 26 Jan 2023 | £274,950 |
No other historical records.
3, Westhall Road, Derby DE3 0PA
| Today | See what it's worth now |
| 31 Mar 2026 | £252,000 |
| 29 Nov 2019 | £190,000 |
3, Hop Place, Derby DE3 0FT
| Today | See what it's worth now |
| 30 Mar 2026 | £278,000 |
| 26 Mar 2021 | £264,950 |
No other historical records.
69, Ladybank Road, Derby DE3 0PF
| Today | See what it's worth now |
| 30 Mar 2026 | £215,000 |
| 27 Apr 1995 | £45,000 |
No other historical records.
34, Martha Road, Derby DE22 4PB
| Today | See what it's worth now |
| 27 Mar 2026 | £205,000 |
| 18 Feb 2022 | £200,500 |
31, Hobart Close, Derby DE3 9LJ
| Today | See what it's worth now |
| 27 Mar 2026 | £370,000 |
| 4 Jul 2019 | £210,000 |
No other historical records.
28, Hobart Close, Derby DE3 9LJ

| Today | See what it's worth now |
| 27 Mar 2026 | £375,000 |
| 30 Apr 2024 | £270,000 |
No other historical records.
10, Cairns Close, Derby DE3 9LW
| Today | See what it's worth now |
| 20 Mar 2026 | £265,000 |
| 23 Oct 2007 | £168,500 |
No other historical records.
2, Banwell Close, Mickleover, Derby DE3 0QP
| Today | See what it's worth now |
| 18 Mar 2026 | £275,000 |
No other historical records.
10, Hobart Close, Derby DE3 9LJ
| Today | See what it's worth now |
| 13 Mar 2026 | £290,000 |
| 2 Mar 2018 | £216,000 |
No other historical records.
10, Agrimony Place, Derby DE3 0FE
| Today | See what it's worth now |
| 13 Mar 2026 | £222,500 |
| 22 Jan 2021 | £194,950 |
No other historical records.
11, Bexley Close, Derby DE22 4NT
| Today | See what it's worth now |
| 13 Mar 2026 | £305,000 |
| 17 Nov 2017 | £219,995 |
No other historical records.
Source Acknowledgement: © Crown copyright. England and Wales house price data is publicly available information produced by the HM Land Registry.This material was last updated on 9 July 2026. It covers the period from 1 January 1995 to 30 April 2026 and contains property transactions which have been registered during that period. Contains HM Land Registry data © Crown copyright and database right 2026. This data is licensed under the Open Government Licence v3.0.
Disclaimer: Rightmove.co.uk provides this HM Land Registry data "as is". The burden for fitness of the data relies completely with the user and is provided for informational purposes only. No warranty, express or implied, is given relating to the accuracy of content of the HM Land Registry data and Rightmove does not accept any liability for error or omission. If you have found an error with the data or need further information please contact HM Land Registry.
Permitted Use: Viewers of this Information are granted permission to access this Crown copyright material and to download it onto electronic, magnetic, optical or similar storage media provided that such activities are for private research, study or in-house use only. Any other use of the material requires the formal written permission of Land Registry which can be requested from us, and is subject to an additional licence and associated charge.
Rightmove takes no liability for your use of, or reliance on, Rightmove's Instant Valuation due to the limitations of our tracking tool listed here. Use of this tool is taken entirely at your own risk. All rights reserved.