
House Prices in Mile End
House prices in Mile End have an overall average of £334,602 over the last year.
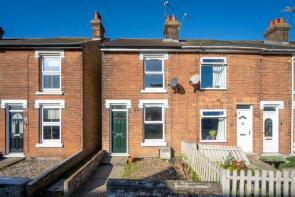
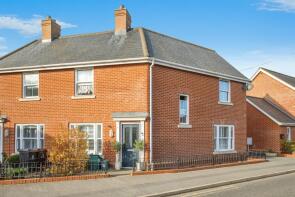
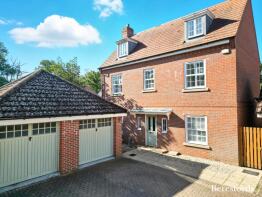
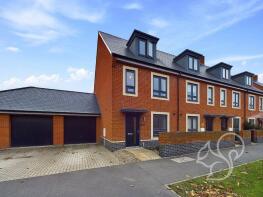
The majority of properties sold in Mile End during the last year were terraced properties, selling for an average price of £324,793. Semi-detached properties sold for an average of £341,911, with detached properties fetching £460,333.
Overall, the historical sold prices in Mile End over the last year were similar to the previous year and similar to the 2021 peak of £337,827.
Properties Sold
70, Nayland Road, Colchester CO4 5EW
| Today | See what it's worth now |
| 17 Apr 2026 | £260,000 |
| 5 Oct 2005 | £128,500 |
40, Nayland Road, Mile End, Colchester CO4 5EN
| Today | See what it's worth now |
| 30 Mar 2026 | £317,500 |
No other historical records.
11, Whitebeam Close, Colchester CO4 5HB
| Today | See what it's worth now |
| 25 Mar 2026 | £575,000 |
| 4 Feb 2022 | £526,000 |
67, Whitmore Drive, Colchester CO4 6BT
| Today | See what it's worth now |
| 20 Mar 2026 | £370,000 |
| 27 Jun 2019 | £349,995 |
No other historical records.
29, Venture Chase, Colchester CO4 5YW
| Today | See what it's worth now |
| 11 Mar 2026 | £225,500 |
| 28 Oct 2019 | £200,000 |
4, Rudkin Road, Colchester CO4 5LT
| Today | See what it's worth now |
| 6 Mar 2026 | £430,000 |
| 18 Aug 2003 | £155,000 |
8, Link Close, Colchester CO4 5EH
| Today | See what it's worth now |
| 5 Mar 2026 | £287,500 |
| 16 Oct 2013 | £157,000 |
18, Defoe Crescent, Colchester CO4 5LG
| Today | See what it's worth now |
| 2 Mar 2026 | £297,500 |
| 29 May 1998 | £50,250 |
No other historical records.
3, Altius Chase, Colchester CO4 5WT
| Today | See what it's worth now |
| 27 Feb 2026 | £300,000 |
| 11 May 2020 | £260,000 |
4, Coeur De Lion, Colchester CO4 5WN
| Today | See what it's worth now |
| 27 Feb 2026 | £375,000 |
| 2 Oct 2000 | £126,000 |
71, Mile End Road, Colchester CO4 5BU
| Today | See what it's worth now |
| 20 Feb 2026 | £307,500 |
| 1 Jul 2013 | £153,500 |
No other historical records.
74, Whitmore Drive, Colchester CO4 6BR
| Today | See what it's worth now |
| 19 Feb 2026 | £380,000 |
| 31 Jan 2020 | £364,995 |
No other historical records.
Apartment 60, 2 Station Square, Bergholt Road, Colchester CO4 6DT

| Today | See what it's worth now |
| 17 Feb 2026 | £350,000 |
| 13 Mar 2020 | £360,000 |
No other historical records.
9, Coeur De Lion, Colchester CO4 5WN
| Today | See what it's worth now |
| 16 Feb 2026 | £250,000 |
| 10 Jul 1998 | £66,000 |
15, Dickenson Road, Colchester CO4 5BL

| Today | See what it's worth now |
| 16 Feb 2026 | £400,000 |
| 25 Jun 2012 | £216,000 |
28, Dickenson Road, Colchester CO4 5BS
| Today | See what it's worth now |
| 13 Feb 2026 | £263,000 |
| 24 Oct 2003 | £139,950 |
No other historical records.
45, Hugh Dickson Road, Colchester CO4 5DE
| Today | See what it's worth now |
| 13 Feb 2026 | £340,000 |
| 28 Sep 2017 | £247,000 |
31, Barton Boulevard, Colchester CO4 5SD
| Today | See what it's worth now |
| 6 Feb 2026 | £350,000 |
| 16 Jul 2015 | £275,000 |
151, Gavin Way, Colchester CO4 9FZ
| Today | See what it's worth now |
| 6 Feb 2026 | £310,000 |
| 30 Sep 2005 | £199,995 |
15, Maplehurst Road, Colchester CO4 6BQ
| Today | See what it's worth now |
| 6 Feb 2026 | £390,000 |
| 1 Jun 2018 | £319,995 |
No other historical records.
Apartment 67, 2 Station Square, Bergholt Road, Colchester CO4 6DT
| Today | See what it's worth now |
| 3 Feb 2026 | £400,000 |
| 4 Apr 2022 | £450,000 |
No other historical records.
16, Brickmakers Lane, Colchester CO4 5WP
| Today | See what it's worth now |
| 3 Feb 2026 | £460,000 |
| 29 Apr 2016 | £340,000 |
8, Oxley Parker Drive, Colchester CO4 5XQ
| Today | See what it's worth now |
| 30 Jan 2026 | £292,000 |
| 28 Oct 2016 | £235,000 |
Source Acknowledgement: © Crown copyright. England and Wales house price data is publicly available information produced by the HM Land Registry.This material was last updated on 9 July 2026. It covers the period from 1 January 1995 to 30 April 2026 and contains property transactions which have been registered during that period. Contains HM Land Registry data © Crown copyright and database right 2026. This data is licensed under the Open Government Licence v3.0.
Disclaimer: Rightmove.co.uk provides this HM Land Registry data "as is". The burden for fitness of the data relies completely with the user and is provided for informational purposes only. No warranty, express or implied, is given relating to the accuracy of content of the HM Land Registry data and Rightmove does not accept any liability for error or omission. If you have found an error with the data or need further information please contact HM Land Registry.
Permitted Use: Viewers of this Information are granted permission to access this Crown copyright material and to download it onto electronic, magnetic, optical or similar storage media provided that such activities are for private research, study or in-house use only. Any other use of the material requires the formal written permission of Land Registry which can be requested from us, and is subject to an additional licence and associated charge.
Rightmove takes no liability for your use of, or reliance on, Rightmove's Instant Valuation due to the limitations of our tracking tool listed here. Use of this tool is taken entirely at your own risk. All rights reserved.