
House Prices in Mosley Common
House prices in Mosley Common have an overall average of £270,944 over the last year.
The majority of properties sold in Mosley Common during the last year were semi-detached properties, selling for an average price of £254,585. Detached properties sold for an average of £417,517, with terraced properties fetching £206,250.
Overall, the historical sold prices in Mosley Common over the last year were 1% up on the previous year and 5% down on the 2023 peak of £284,986.
Properties Sold
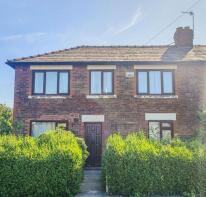
45, Silk Mill Street, Manchester M28 1NX
| Today | See what it's worth now |
| 26 Feb 2026 | £315,000 |
| 29 Jun 2023 | £309,995 |
No other historical records.
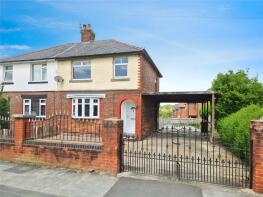
47, Glendale Road, Worsley M28 1AZ
| Today | See what it's worth now |
| 30 Jan 2026 | £280,000 |
No other historical records.
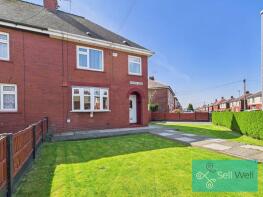
75, Gilda Road, Manchester M28 1BP
| Today | See what it's worth now |
| 9 Jan 2026 | £260,000 |
| 9 Jan 2026 | £260,000 |
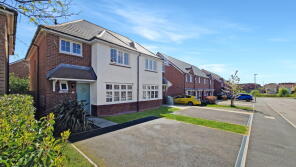
6, Bridgefield Close, Manchester M29 8QX
| Today | See what it's worth now |
| 18 Dec 2025 | £445,000 |
| 8 Jun 2018 | £384,995 |
No other historical records.
54, Gilda Road, Manchester M28 1BP
| Today | See what it's worth now |
| 12 Dec 2025 | £270,000 |
| 17 Mar 2021 | £210,000 |
29, Grange Road, Manchester M28 1AT
| Today | See what it's worth now |
| 5 Dec 2025 | £226,000 |
| 12 Feb 2015 | £110,000 |
No other historical records.
39, Border Brook Lane, Manchester M28 1XJ
| Today | See what it's worth now |
| 5 Dec 2025 | £232,500 |
| 1 Jul 2016 | £165,000 |
172, Mosley Common Road, Worsley M28 1AF
| Today | See what it's worth now |
| 1 Dec 2025 | £240,000 |
No other historical records.
21, Thornton Road, Manchester M28 1AX

| Today | See what it's worth now |
| 28 Nov 2025 | £223,200 |
| 23 Jun 2017 | £137,000 |
No other historical records.
9, Church Vale, Manchester M28 1GD
| Today | See what it's worth now |
| 7 Nov 2025 | £270,000 |
| 14 Jun 2019 | £199,995 |
No other historical records.
27, St Johns Road, Manchester M28 1PA
| Today | See what it's worth now |
| 31 Oct 2025 | £280,000 |
| 29 Nov 2002 | £101,750 |
No other historical records.
44, Border Brook Lane, Manchester M28 1XJ
| Today | See what it's worth now |
| 17 Oct 2025 | £238,500 |
| 15 Nov 2019 | £180,000 |
15, Parr Bridge Pastures, Manchester M29 8SF
| Today | See what it's worth now |
| 10 Oct 2025 | £135,000 |
| 16 Sep 2022 | £126,000 |
No other historical records.
1, Oliver Fold Close, Manchester M28 1EL
| Today | See what it's worth now |
| 29 Sep 2025 | £325,100 |
| 12 Mar 2010 | £230,000 |
5, Thornton Road, Worsley M28 1AX
| Today | See what it's worth now |
| 12 Sep 2025 | £180,000 |
No other historical records.
10, Garrett Hall Road, Manchester M28 1AW
| Today | See what it's worth now |
| 12 Sep 2025 | £232,000 |
| 25 Apr 2008 | £120,000 |
7, Weavers Close, Manchester M28 1PE
| Today | See what it's worth now |
| 9 Sep 2025 | £425,000 |
| 27 May 2022 | £305,995 |
No other historical records.
10, Malton Road, Worsley M28 1AS
| Today | See what it's worth now |
| 2 Sep 2025 | £225,000 |
No other historical records.
51, Garrett Hall Road, Manchester M28 1AQ
| Today | See what it's worth now |
| 8 Aug 2025 | £550,000 |
No other historical records.
9, Parr Bridge Pastures, Manchester M29 8SF
| Today | See what it's worth now |
| 8 Aug 2025 | £345,000 |
| 22 Oct 2020 | £251,995 |
No other historical records.
31, Queens Close, Manchester M28 1BQ
| Today | See what it's worth now |
| 8 Aug 2025 | £317,000 |
| 13 Oct 2017 | £193,000 |
No other historical records.
14, Foxfold Close, Manchester M28 1EJ
| Today | See what it's worth now |
| 25 Jul 2025 | £275,000 |
| 7 Jul 2017 | £170,000 |
122, Chaddock Lane, Manchester M28 1DF
| Today | See what it's worth now |
| 24 Jul 2025 | £195,000 |
| 13 Jan 2012 | £110,000 |
108, Chaddock Lane, Manchester M28 1DF

| Today | See what it's worth now |
| 22 Jul 2025 | £205,000 |
| 13 May 2016 | £116,000 |
2, Farnworth Grove, Manchester M28 1PF
| Today | See what it's worth now |
| 18 Jul 2025 | £320,000 |
| 28 Apr 2023 | £309,995 |
No other historical records.
Source Acknowledgement: © Crown copyright. England and Wales house price data is publicly available information produced by the HM Land Registry.This material was last updated on 15 May 2026. It covers the period from 1 January 1995 to 31 March 2026 and contains property transactions which have been registered during that period. Contains HM Land Registry data © Crown copyright and database right 2026. This data is licensed under the Open Government Licence v3.0.
Disclaimer: Rightmove.co.uk provides this HM Land Registry data "as is". The burden for fitness of the data relies completely with the user and is provided for informational purposes only. No warranty, express or implied, is given relating to the accuracy of content of the HM Land Registry data and Rightmove does not accept any liability for error or omission. If you have found an error with the data or need further information please contact HM Land Registry.
Permitted Use: Viewers of this Information are granted permission to access this Crown copyright material and to download it onto electronic, magnetic, optical or similar storage media provided that such activities are for private research, study or in-house use only. Any other use of the material requires the formal written permission of Land Registry which can be requested from us, and is subject to an additional licence and associated charge.
Map data ©OpenStreetMap contributors.
Rightmove takes no liability for your use of, or reliance on, Rightmove's Instant Valuation due to the limitations of our tracking tool listed here. Use of this tool is taken entirely at your own risk. All rights reserved.