
House Prices in NE61
House prices in NE61 have an overall average of £290,335 over the last year.
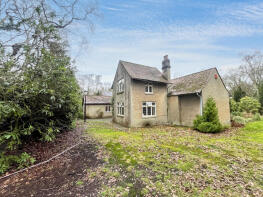
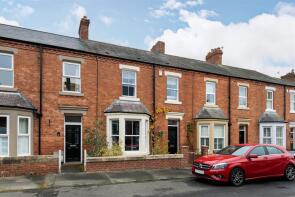
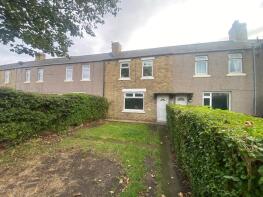
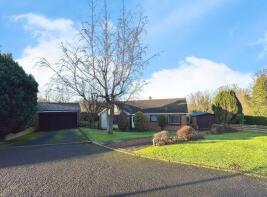
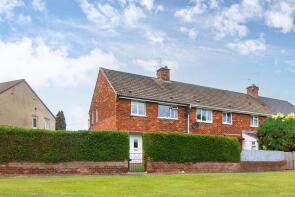
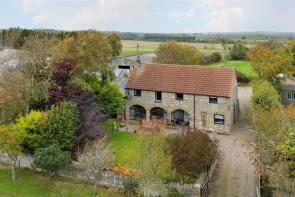
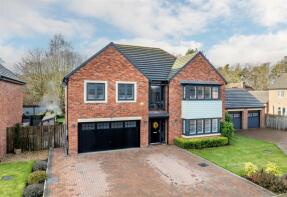
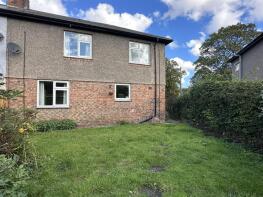
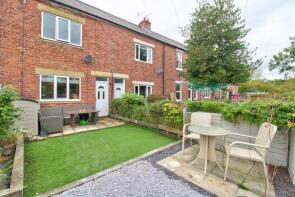
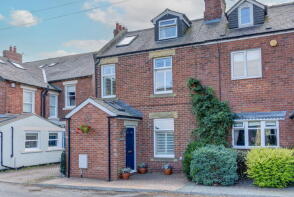
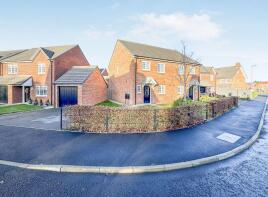
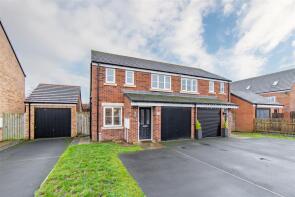
The majority of properties sold in NE61 during the last year were semi-detached properties, selling for an average price of £247,641. Detached properties sold for an average of £415,537, with terraced properties fetching £208,066.
Overall, the historical sold prices in NE61 over the last year were 2% up on the previous year and 6% up on the 2023 peak of £272,951.
Properties Sold
Birchwood, C152 Gubeon Plantations Junction To Well Hgill Junction, Morpeth NE61 6AG
| Today | See what it's worth now |
| 28 Apr 2026 | £425,000 |
| 27 Jul 2007 | £2,400,000 |
36, Hood Street, Morpeth NE61 1JF
| Today | See what it's worth now |
| 24 Apr 2026 | £303,000 |
| 7 Nov 2008 | £149,000 |
No other historical records.
5, Dalton Avenue, Morpeth NE61 5TD
| Today | See what it's worth now |
| 24 Apr 2026 | £75,000 |
| 26 Jul 2002 | £17,000 |
No other historical records.
Extensions and planning permission in NE61
See planning approval stats, extension build costs and value added estimates.

5, Bankside, Allery Banks, Morpeth NE61 1XD
| Today | See what it's worth now |
| 24 Apr 2026 | £440,000 |
| 1 Sep 2008 | £312,500 |
8 Hale Bopp Heights, Whalton Park, Morpeth NE61 3TU
| Today | See what it's worth now |
| 10 Apr 2026 | £260,000 |
| 14 Jan 2011 | £238,000 |
5, Woodman Close, Kirkhill, Morpeth NE61 2RB
| Today | See what it's worth now |
| 10 Apr 2026 | £232,500 |
| 17 Mar 2023 | £195,000 |
No other historical records.
27, Burghley Gardens, Brocksburn Park, Morpeth NE61 6TN
| Today | See what it's worth now |
| 9 Apr 2026 | £332,000 |
| 31 May 2023 | £260,000 |
30, Townsend Crescent, Kirkhill, Morpeth NE61 2XT
| Today | See what it's worth now |
| 8 Apr 2026 | £440,000 |
| 10 Dec 2021 | £410,000 |
11, Abbots Way, Highchurch, Morpeth NE61 2LY
| Today | See what it's worth now |
| 8 Apr 2026 | £210,000 |
| 10 Apr 2018 | £125,000 |
No other historical records.
The Old Granary, West Molesden, Morpeth NE61 3QF
| Today | See what it's worth now |
| 2 Apr 2026 | £800,000 |
| 7 Jun 2019 | £540,000 |
2, Pele Court, Morpeth NE61 6FL
| Today | See what it's worth now |
| 2 Apr 2026 | £600,000 |
| 28 Sep 2020 | £499,995 |
No other historical records.
18, High Stanners, Morpeth NE61 1QU
| Today | See what it's worth now |
| 1 Apr 2026 | £230,000 |
| 24 Feb 2000 | £70,000 |
30, Stobhill Villas, Morpeth NE61 2SH

| Today | See what it's worth now |
| 1 Apr 2026 | £250,000 |
No other historical records.
105, Second Avenue, Stobhill Gate, Morpeth NE61 2HQ
| Today | See what it's worth now |
| 31 Mar 2026 | £155,000 |
| 26 Sep 2018 | £110,000 |
3, South Side, Whalton NE61 3XE
| Today | See what it's worth now |
| 31 Mar 2026 | £304,140 |
No other historical records.
78, Dalton Avenue, Morpeth NE61 5TH

| Today | See what it's worth now |
| 30 Mar 2026 | £37,250 |
| 13 Nov 2003 | £39,500 |
7, Harewood Gardens, Brocksburn Park, Morpeth NE61 6TG

| Today | See what it's worth now |
| 30 Mar 2026 | £245,000 |
| 16 Sep 2024 | £250,000 |
41, Silvas Court, Dacre Street, Morpeth NE61 1HQ
| Today | See what it's worth now |
| 30 Mar 2026 | £159,950 |
| 20 Aug 2019 | £180,000 |
3, Green Close, Morpeth NE61 6PE
| Today | See what it's worth now |
| 30 Mar 2026 | £375,000 |
| 16 Mar 2001 | £108,000 |
No other historical records.
4, Crawford Terrace, Middle Greens, Morpeth NE61 1UA
| Today | See what it's worth now |
| 27 Mar 2026 | £190,000 |
| 2 Feb 2018 | £120,000 |
Burncrest, Side Lane, Hepscott NE61 6LS
| Today | See what it's worth now |
| 27 Mar 2026 | £375,000 |
| 7 Jun 1996 | £64,000 |
No other historical records.
17, Copperfield Drive, St Georges Wood, Morpeth NE61 2GH
| Today | See what it's worth now |
| 26 Mar 2026 | £268,000 |
| 22 Nov 2022 | £245,000 |
15, Marigold Way, Fairmoor Meadows, Morpeth NE61 3FP
| Today | See what it's worth now |
| 20 Mar 2026 | £252,500 |
| 20 Dec 2018 | £202,950 |
No other historical records.

Source Acknowledgement: © Crown copyright. England and Wales house price data is publicly available information produced by the HM Land Registry.This material was last updated on 9 July 2026. It covers the period from 1 January 1995 to 30 April 2026 and contains property transactions which have been registered during that period. Contains HM Land Registry data © Crown copyright and database right 2026. This data is licensed under the Open Government Licence v3.0.
Disclaimer: Rightmove.co.uk provides this HM Land Registry data "as is". The burden for fitness of the data relies completely with the user and is provided for informational purposes only. No warranty, express or implied, is given relating to the accuracy of content of the HM Land Registry data and Rightmove does not accept any liability for error or omission. If you have found an error with the data or need further information please contact HM Land Registry.
Permitted Use: Viewers of this Information are granted permission to access this Crown copyright material and to download it onto electronic, magnetic, optical or similar storage media provided that such activities are for private research, study or in-house use only. Any other use of the material requires the formal written permission of Land Registry which can be requested from us, and is subject to an additional licence and associated charge.
Rightmove takes no liability for your use of, or reliance on, Rightmove's Instant Valuation due to the limitations of our tracking tool listed here. Use of this tool is taken entirely at your own risk. All rights reserved.