
House Prices in NE65
House prices in NE65 have an overall average of £327,018 over the last year.
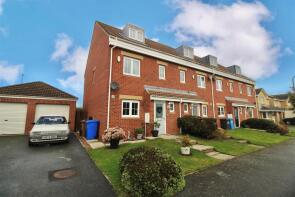
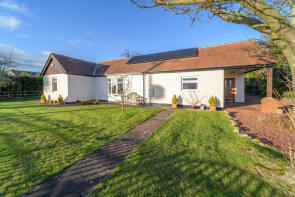
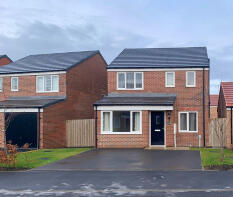
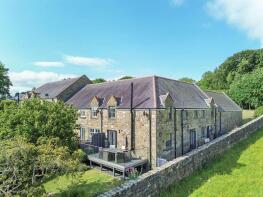
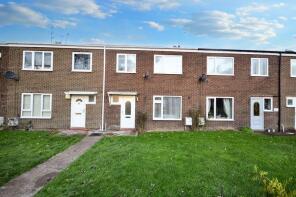
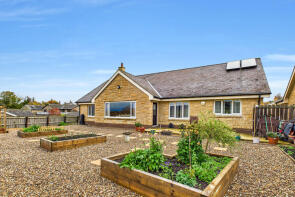
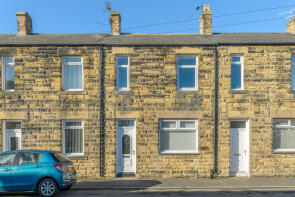
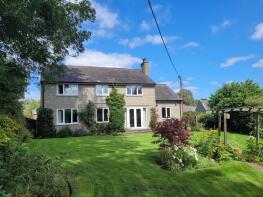
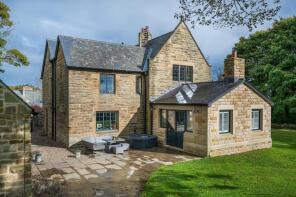
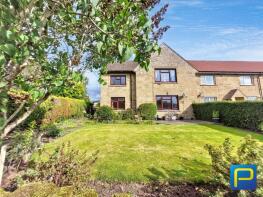
The majority of properties sold in NE65 during the last year were detached properties, selling for an average price of £459,536. Terraced properties sold for an average of £222,915, with semi-detached properties fetching £219,979.
Overall, the historical sold prices in NE65 over the last year were 8% up on the previous year and 7% up on the 2022 peak of £304,582.
Properties Sold
20, The Dunes, Morpeth NE65 9RG
| Today | See what it's worth now |
| 27 Apr 2026 | £185,000 |
| 30 Jun 2008 | £200,000 |
No other historical records.
42, Park Road, Morpeth NE65 9JD
| Today | See what it's worth now |
| 14 Apr 2026 | £640,000 |
| 18 Sep 2008 | £325,000 |
No other historical records.
6, Shearwater Drive, North Sea Manor, Amble NE65 0DF
| Today | See what it's worth now |
| 13 Apr 2026 | £239,950 |
| 21 Dec 2023 | £211,950 |
No other historical records.
Extensions and planning permission in NE65
See planning approval stats, extension build costs and value added estimates.

3, Linden Cottages, Morpeth NE65 8XE
| Today | See what it's worth now |
| 2 Apr 2026 | £320,000 |
| 26 Feb 1996 | £70,000 |
No other historical records.
4, The Orchard, Morpeth NE65 8AS
| Today | See what it's worth now |
| 1 Apr 2026 | £450,000 |
| 28 Jul 2015 | £279,000 |
17, The Pinfold, Morpeth NE65 7TN

| Today | See what it's worth now |
| 30 Mar 2026 | £155,000 |
| 6 Apr 2018 | £105,000 |
17, Coquet Square, Morpeth NE65 9TB
| Today | See what it's worth now |
| 30 Mar 2026 | £133,000 |
| 25 Nov 2024 | £125,000 |
3, Burnside, Morpeth NE65 7EF
| Today | See what it's worth now |
| 27 Mar 2026 | £550,000 |
| 25 Sep 2020 | £368,500 |
No other historical records.
Butterchurn, Cavil Head Farm, Cavil Head Road, Morpeth NE65 9DF
| Today | See what it's worth now |
| 26 Mar 2026 | £457,500 |
| 9 Sep 2016 | £338,000 |
No other historical records.
6, Netherton South Side, Netherton Village, Morpeth NE65 7EZ
| Today | See what it's worth now |
| 25 Mar 2026 | £253,000 |
| 21 Sep 2001 | £120,000 |
14, Sea View, Morpeth NE65 8DS
| Today | See what it's worth now |
| 24 Mar 2026 | £119,500 |
| 11 Jan 2021 | £96,250 |
School Field House, The Parks, South Broomhill NE65 9RR
| Today | See what it's worth now |
| 24 Mar 2026 | £427,500 |
No other historical records.
24, Scott Street, Morpeth NE65 0NU
| Today | See what it's worth now |
| 24 Mar 2026 | £150,000 |
| 21 Apr 2017 | £112,950 |
No other historical records.
3, Roseate View, Morpeth NE65 0ZD
| Today | See what it's worth now |
| 20 Mar 2026 | £425,000 |
| 11 Sep 2020 | £299,950 |
No other historical records.
4, Springwood, Morpeth NE65 9QS

| Today | See what it's worth now |
| 20 Mar 2026 | £610,000 |
| 12 Apr 2017 | £437,000 |
18, Middleton Street, Morpeth NE65 0ET
| Today | See what it's worth now |
| 20 Mar 2026 | £189,000 |
| 10 Oct 2024 | £115,000 |
The Wynd, U4058 Holystone To Kidland Forest, Morpeth NE65 7AJ
| Today | See what it's worth now |
| 19 Mar 2026 | £440,000 |
| 11 Aug 2000 | £130,000 |
No other historical records.
8 North Lodge, Park Road, Morpeth NE65 9JD
| Today | See what it's worth now |
| 16 Mar 2026 | £720,000 |
| 4 Apr 2019 | £550,000 |
1, Cherrywell, Morpeth NE65 7HD
| Today | See what it's worth now |
| 13 Mar 2026 | £180,000 |
| 8 Apr 1998 | £64,950 |
No other historical records.
14, Jubilee Crescent, Morpeth NE65 7QZ
| Today | See what it's worth now |
| 12 Mar 2026 | £183,000 |
| 29 Jul 2022 | £160,000 |
26, Whitton View, Morpeth NE65 7QN
| Today | See what it's worth now |
| 12 Mar 2026 | £265,000 |
| 29 Nov 2024 | £255,000 |
North Croft, C176 Snitter Junction To Netherton Village, Morpeth NE65 7EJ
| Today | See what it's worth now |
| 9 Mar 2026 | £150,000 |
| 11 Sep 2009 | £145,000 |
55, Hartside Crescent, Morpeth NE65 9YD
| Today | See what it's worth now |
| 6 Mar 2026 | £125,000 |
| 1 Jun 2022 | £110,000 |
Source Acknowledgement: © Crown copyright. England and Wales house price data is publicly available information produced by the HM Land Registry.This material was last updated on 9 July 2026. It covers the period from 1 January 1995 to 30 April 2026 and contains property transactions which have been registered during that period. Contains HM Land Registry data © Crown copyright and database right 2026. This data is licensed under the Open Government Licence v3.0.
Disclaimer: Rightmove.co.uk provides this HM Land Registry data "as is". The burden for fitness of the data relies completely with the user and is provided for informational purposes only. No warranty, express or implied, is given relating to the accuracy of content of the HM Land Registry data and Rightmove does not accept any liability for error or omission. If you have found an error with the data or need further information please contact HM Land Registry.
Permitted Use: Viewers of this Information are granted permission to access this Crown copyright material and to download it onto electronic, magnetic, optical or similar storage media provided that such activities are for private research, study or in-house use only. Any other use of the material requires the formal written permission of Land Registry which can be requested from us, and is subject to an additional licence and associated charge.
Rightmove takes no liability for your use of, or reliance on, Rightmove's Instant Valuation due to the limitations of our tracking tool listed here. Use of this tool is taken entirely at your own risk. All rights reserved.