
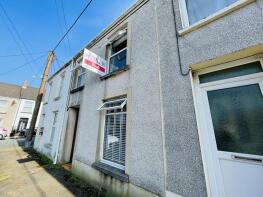
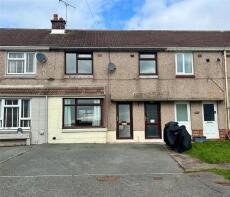
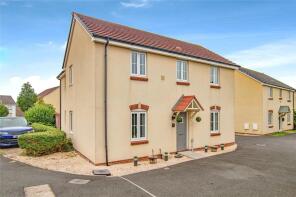
House Prices in Neeston
House prices in Neeston have an overall average of £174,023 over the last year.
The majority of properties sold in Neeston during the last year were terraced properties, selling for an average price of £146,295. Semi-detached properties sold for an average of £171,403, with detached properties fetching £284,227.
Overall, the historical sold prices in Neeston over the last year were similar to the previous year and 3% down on the 2022 peak of £179,026.
Properties Sold
65, Precelly Place, Milford Haven SA73 2BW
| Today | See what it's worth now |
| 15 Apr 2026 | £110,000 |
| 27 Jul 2001 | £35,000 |
No other historical records.
41, Starbuck Road, Milford Haven SA73 2BB

| Today | See what it's worth now |
| 2 Apr 2026 | £170,000 |
| 14 Mar 2023 | £165,000 |
22, Wellington Road, Hakin, Milford Haven SA73 3BT
| Today | See what it's worth now |
| 27 Mar 2026 | £234,000 |
| 18 Feb 2022 | £177,000 |
No other historical records.
16, Neptune House, Nelson Quay, Milford Haven SA73 3BH
| Today | See what it's worth now |
| 27 Mar 2026 | £130,000 |
| 10 Feb 2023 | £105,000 |
22, St Peters Road, Milford Haven SA73 2BT
| Today | See what it's worth now |
| 20 Mar 2026 | £122,500 |
| 9 Aug 1996 | £37,000 |
No other historical records.
39, Croft Avenue, Hakin, Milford Haven SA73 3HF
| Today | See what it's worth now |
| 19 Mar 2026 | £160,000 |
| 12 Dec 2019 | £75,000 |
No other historical records.
17, Sovereign House, Nelson Quay, Milford Haven SA73 3AJ

| Today | See what it's worth now |
| 13 Mar 2026 | £57,000 |
| 10 Feb 2017 | £107,000 |
No other historical records.
70, Stratford Road, Milford Haven SA73 2JD
| Today | See what it's worth now |
| 12 Mar 2026 | £175,000 |
| 13 May 2016 | £107,500 |
21, Gorsewood Drive, Hakin, Milford Haven SA73 3EP

| Today | See what it's worth now |
| 11 Mar 2026 | £249,999 |
No other historical records.
44, Dewsland Street, Milford Haven SA73 2AU
| Today | See what it's worth now |
| 26 Feb 2026 | £118,000 |
| 20 Aug 2021 | £118,500 |
7, George Street, Milford Haven SA73 2AY
| Today | See what it's worth now |
| 26 Feb 2026 | £130,000 |
| 8 Jul 2005 | £92,000 |
122, Observatory Avenue, Hakin, Milford Haven SA73 3EU
| Today | See what it's worth now |
| 20 Feb 2026 | £120,000 |
| 3 Aug 2005 | £79,500 |
14b Coralstone, Hayston Avenue, Hakin, Milford Haven SA73 3EB
| Today | See what it's worth now |
| 20 Feb 2026 | £325,000 |
| 31 Mar 2023 | £300,000 |
No other historical records.
9, Wentworth Close, Hubberston, Milford Haven SA73 3SF
| Today | See what it's worth now |
| 16 Feb 2026 | £250,000 |
| 31 Jan 2020 | £189,000 |
Lamb Cottage, U6045 Herbrandston To Sandy Haven Pill, Herbrandston, Milford Haven SA73 3SS
| Today | See what it's worth now |
| 12 Feb 2026 | £225,000 |
| 10 Jul 2020 | £167,000 |
2, Havens Park, Herbrandston, Milford Haven SA73 3SH

| Today | See what it's worth now |
| 9 Feb 2026 | £230,000 |
| 14 Jul 2005 | £119,000 |
No other historical records.
4, Pier Road, Milford Haven SA73 3BA
| Today | See what it's worth now |
| 16 Jan 2026 | £355,000 |
| 11 Feb 2000 | £58,000 |
No other historical records.
9, St Peters Road, Milford Haven SA73 2BU

| Today | See what it's worth now |
| 18 Dec 2025 | £145,000 |
| 5 Feb 2021 | £103,500 |
25, Edward Street, Milford Haven SA73 2HY
| Today | See what it's worth now |
| 16 Dec 2025 | £95,000 |
No other historical records.
12, Camuset Close, Hakin, Milford Haven SA73 3NN
| Today | See what it's worth now |
| 5 Dec 2025 | £145,000 |
| 17 Mar 2006 | £108,000 |
Talbot House, C3001 St Lawrence Hill To Junction C3006, Hubberston, Milford Haven SA73 3PR

| Today | See what it's worth now |
| 27 Nov 2025 | £135,000 |
| 11 Nov 2011 | £79,000 |
25, Dartmouth Gardens, Milford Haven SA73 2AP
| Today | See what it's worth now |
| 26 Nov 2025 | £151,500 |
| 29 Nov 2019 | £110,000 |
54, Priory Road, Milford Haven SA73 2DZ

| Today | See what it's worth now |
| 11 Nov 2025 | £175,000 |
No other historical records.

Source Acknowledgement: © Crown copyright. England and Wales house price data is publicly available information produced by the HM Land Registry.This material was last updated on 9 July 2026. It covers the period from 1 January 1995 to 30 April 2026 and contains property transactions which have been registered during that period. Contains HM Land Registry data © Crown copyright and database right 2026. This data is licensed under the Open Government Licence v3.0.
Disclaimer: Rightmove.co.uk provides this HM Land Registry data "as is". The burden for fitness of the data relies completely with the user and is provided for informational purposes only. No warranty, express or implied, is given relating to the accuracy of content of the HM Land Registry data and Rightmove does not accept any liability for error or omission. If you have found an error with the data or need further information please contact HM Land Registry.
Permitted Use: Viewers of this Information are granted permission to access this Crown copyright material and to download it onto electronic, magnetic, optical or similar storage media provided that such activities are for private research, study or in-house use only. Any other use of the material requires the formal written permission of Land Registry which can be requested from us, and is subject to an additional licence and associated charge.
Rightmove takes no liability for your use of, or reliance on, Rightmove's Instant Valuation due to the limitations of our tracking tool listed here. Use of this tool is taken entirely at your own risk. All rights reserved.