
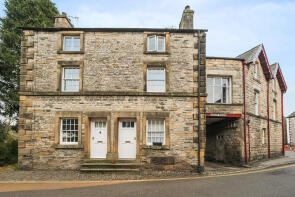
House Prices in Nether Burrow
House prices in Nether Burrow have an overall average of £365,500 over the last year.
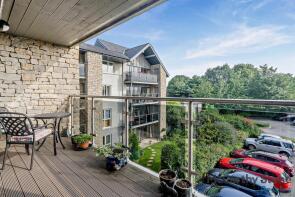
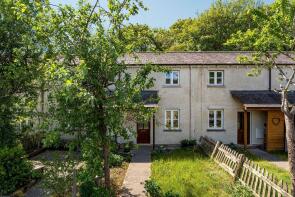
The majority of properties sold in Nether Burrow during the last year were terraced properties, selling for an average price of £204,444. Semi-detached properties sold for an average of £531,667, with flats fetching £186,668.
Overall, the historical sold prices in Nether Burrow over the last year were 20% down on the previous year and 30% down on the 2023 peak of £525,191.
Properties Sold
5, Queens Square, Carnforth LA6 2AZ
| Today | See what it's worth now |
| 12 Mar 2026 | £188,000 |
| 2 Aug 2002 | £115,000 |
No other historical records.
21, Queen Elizabeth Court, Tram Lane, Carnforth LA6 2FF
| Today | See what it's worth now |
| 10 Mar 2026 | £220,000 |
| 28 Aug 2014 | £220,000 |
No other historical records.
44, Mitchelgate, Carnforth LA6 2BE

| Today | See what it's worth now |
| 20 Feb 2026 | £250,000 |
| 30 Jan 2008 | £235,000 |
9, The Old Tannery, Mill Brow, Kirkby Lonsdale LA6 2AT
| Today | See what it's worth now |
| 17 Feb 2026 | £250,000 |
| 14 Dec 1998 | £75,000 |
No other historical records.
5, Raygarth Gardens, Raygarth, Carnforth LA6 2DP
| Today | See what it's worth now |
| 12 Feb 2026 | £93,000 |
| 13 Nov 2009 | £78,000 |
No other historical records.
2, Back Lane, Carnforth LA6 2AP
| Today | See what it's worth now |
| 30 Jan 2026 | £315,000 |
| 20 Dec 2016 | £225,000 |
15, Lower Abbotsgate, Carnforth LA6 2JU
| Today | See what it's worth now |
| 29 Jan 2026 | £445,000 |
| 7 Jun 2018 | £215,000 |
Marthwaite, Casterton, Kirkby Lonsdale LA6 2SA
| Today | See what it's worth now |
| 10 Dec 2025 | £225,000 |
No other historical records.
Westerholme, Casterton, Carnforth LA6 2RX
| Today | See what it's worth now |
| 9 Dec 2025 | £230,000 |
| 27 Mar 2013 | £195,500 |
2, Modera Fold, Low Biggins LA6 2GX
| Today | See what it's worth now |
| 5 Dec 2025 | £890,000 |
No other historical records.
Amberley, Burrow Road, Carnforth LA6 2RJ
| Today | See what it's worth now |
| 21 Nov 2025 | £200,000 |
| 10 Aug 2015 | £200,000 |
No other historical records.
2, Vicarage Lane, Carnforth LA6 2BA
| Today | See what it's worth now |
| 21 Nov 2025 | £310,000 |
| 24 May 2019 | £263,000 |
Flat 12, Eaveslea, New Road, Carnforth LA6 2AB
| Today | See what it's worth now |
| 17 Oct 2025 | £164,000 |
| 20 Jul 2021 | £160,000 |
No other historical records.
Old Vicarage, Casterton, Kirkby Lonsdale LA6 2SA
| Today | See what it's worth now |
| 3 Oct 2025 | £970,000 |
No other historical records.
1, Modera Fold, Low Biggins LA6 2GX
| Today | See what it's worth now |
| 30 Sep 2025 | £885,000 |
No other historical records.
44, Oakfield Park, Carnforth LA6 2FQ
| Today | See what it's worth now |
| 29 Sep 2025 | £127,508 |
| 9 Jun 2021 | £90,741 |
No other historical records.
Sellet Mill Cottage, Mill Lane, Carnforth LA6 2DG
| Today | See what it's worth now |
| 2 Sep 2025 | £518,000 |
| 7 Jun 2019 | £380,000 |
1, Braeside, Church Street, Whittington LA6 2NU
| Today | See what it's worth now |
| 29 Aug 2025 | £430,000 |
No other historical records.
Church Place Cottage, Melling Road, Carnforth LA6 2RA
| Today | See what it's worth now |
| 29 Aug 2025 | £200,000 |
| 5 Feb 2021 | £151,225 |
No other historical records.
Bridge End, Barbon, Carnforth LA6 2LT
| Today | See what it's worth now |
| 29 Aug 2025 | £1,200,000 |
No other historical records.
5, The Maltings, Carnforth LA6 2NJ
| Today | See what it's worth now |
| 15 Aug 2025 | £215,000 |
| 18 Jun 2009 | £165,000 |
Flat 10, Eaveslea, New Road, Carnforth LA6 2AB

| Today | See what it's worth now |
| 8 Aug 2025 | £193,500 |
| 17 Jun 2005 | £130,000 |
No other historical records.
6, Moorside Close, Carnforth LA6 2RF
| Today | See what it's worth now |
| 7 Aug 2025 | £440,000 |
| 29 Jun 2018 | £290,000 |
Source Acknowledgement: © Crown copyright. England and Wales house price data is publicly available information produced by the HM Land Registry.This material was last updated on 9 July 2026. It covers the period from 1 January 1995 to 30 April 2026 and contains property transactions which have been registered during that period. Contains HM Land Registry data © Crown copyright and database right 2026. This data is licensed under the Open Government Licence v3.0.
Disclaimer: Rightmove.co.uk provides this HM Land Registry data "as is". The burden for fitness of the data relies completely with the user and is provided for informational purposes only. No warranty, express or implied, is given relating to the accuracy of content of the HM Land Registry data and Rightmove does not accept any liability for error or omission. If you have found an error with the data or need further information please contact HM Land Registry.
Permitted Use: Viewers of this Information are granted permission to access this Crown copyright material and to download it onto electronic, magnetic, optical or similar storage media provided that such activities are for private research, study or in-house use only. Any other use of the material requires the formal written permission of Land Registry which can be requested from us, and is subject to an additional licence and associated charge.
Rightmove takes no liability for your use of, or reliance on, Rightmove's Instant Valuation due to the limitations of our tracking tool listed here. Use of this tool is taken entirely at your own risk. All rights reserved.