
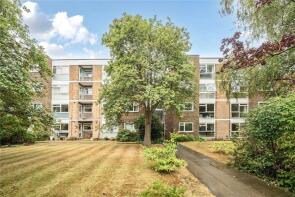
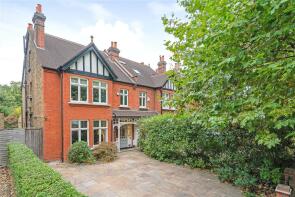
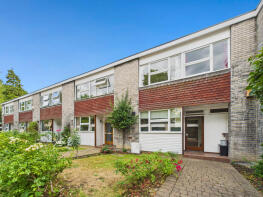
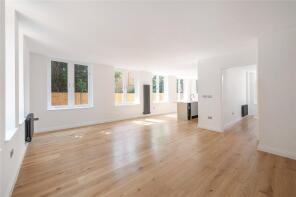
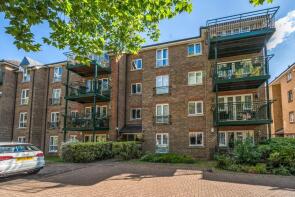
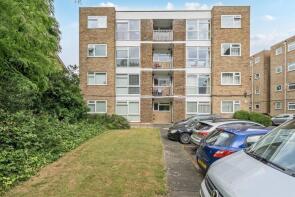
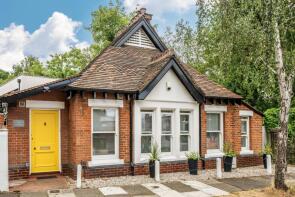
House Prices in New Beckenham
House prices in New Beckenham have an overall average of £535,250 over the last year.
The majority of properties sold in New Beckenham during the last year were flats, selling for an average price of £367,727. Semi-detached properties sold for an average of £1,009,281, with terraced properties fetching £788,970.
Overall, the historical sold prices in New Beckenham over the last year were 2% up on the previous year and 1% up on the 2022 peak of £527,480.
Properties Sold
Flat 6, 7 Sycamore Court, Copers Cope Road, Beckenham BR3 1NE
| Today | See what it's worth now |
| 8 Apr 2026 | £430,000 |
| 8 Feb 2008 | £310,000 |
12, 4 Bouverie Lodge, Rectory Road, Beckenham BR3 1TU
| Today | See what it's worth now |
| 30 Mar 2026 | £242,500 |
| 31 Aug 2017 | £245,000 |
13, Monivea Road, Beckenham BR3 1HJ
| Today | See what it's worth now |
| 27 Mar 2026 | £825,000 |
| 16 Jul 2021 | £766,500 |
7, Silverwood Close, Beckenham BR3 1RN

| Today | See what it's worth now |
| 26 Mar 2026 | £415,000 |
| 14 Jun 2022 | £385,000 |
23, Parkwood, Beckenham BR3 1TR
| Today | See what it's worth now |
| 18 Mar 2026 | £720,000 |
| 20 Aug 1997 | £150,000 |
No other historical records.
Flat 3, 50, Copers Cope Road, Beckenham BR3 1NP
| Today | See what it's worth now |
| 17 Mar 2026 | £415,000 |
| 28 Oct 2022 | £420,000 |
Flat 3, 6 8 Regents Court, Copers Cope Road, Beckenham BR3 1NB
| Today | See what it's worth now |
| 10 Mar 2026 | £465,000 |
| 27 Mar 2015 | £360,000 |
6, Rectory Gardens, Rectory Road, Beckenham BR3 1HN

| Today | See what it's worth now |
| 9 Mar 2026 | £380,000 |
| 30 Nov 2011 | £249,950 |
No other historical records.
Flat 28, 83 Shelbourne Place, Park Road, Beckenham BR3 1QQ
| Today | See what it's worth now |
| 26 Feb 2026 | £400,000 |
| 11 Oct 2006 | £246,000 |
118, Kent House Road, Beckenham BR3 1JY
| Today | See what it's worth now |
| 20 Feb 2026 | £815,000 |
No other historical records.
Flat 6, 73, Park Road, Beckenham BR3 1QQ

| Today | See what it's worth now |
| 12 Feb 2026 | £430,000 |
| 15 Jul 2022 | £440,000 |
Flat 30, 14 Sinclair Court, Copers Cope Road, Beckenham BR3 1PA
| Today | See what it's worth now |
| 11 Feb 2026 | £270,000 |
| 28 Feb 2002 | £115,000 |
No other historical records.
4, 20 Rectory Court, Rectory Road, Beckenham BR3 1JA
| Today | See what it's worth now |
| 31 Jan 2026 | £500,000 |
| 29 Aug 2007 | £235,000 |
No other historical records.
205, Kings Hall Road, Beckenham BR3 1LL
| Today | See what it's worth now |
| 30 Jan 2026 | £1,450,000 |
| 5 Dec 2014 | £1,040,000 |
5, Beck River Park, Beckenham BR3 1HT
| Today | See what it's worth now |
| 30 Jan 2026 | £670,000 |
No other historical records.
7, Bridgelands Close, Beckenham BR3 1JU
| Today | See what it's worth now |
| 30 Jan 2026 | £629,000 |
| 11 Jan 2006 | £256,000 |
Flat 1, Bearstead House, Abbey Park, Beckenham BR3 1PP
| Today | See what it's worth now |
| 19 Jan 2026 | £375,000 |
| 11 Dec 2020 | £350,000 |
No other historical records.
247, Kent House Road, Beckenham BR3 1JQ
| Today | See what it's worth now |
| 8 Jan 2026 | £900,000 |
No other historical records.
18, Beckett Walk, Beckenham BR3 1JH
| Today | See what it's worth now |
| 7 Jan 2026 | £415,000 |
No other historical records.
5a, Lawn Road, Beckenham BR3 1RH
| Today | See what it's worth now |
| 22 Dec 2025 | £850,000 |
No other historical records.
Flat 16, 5a Willow Court, Copers Cope Road, Beckenham BR3 1PB
| Today | See what it's worth now |
| 19 Dec 2025 | £465,000 |
| 14 Sep 2005 | £249,995 |
29, Adelaide Court, Copers Cope Road, Beckenham BR3 1TT
| Today | See what it's worth now |
| 19 Dec 2025 | £315,000 |
No other historical records.
127, Park Road, Beckenham BR3 1QJ
| Today | See what it's worth now |
| 16 Dec 2025 | £560,000 |
| 25 Aug 2021 | £479,000 |

Source Acknowledgement: © Crown copyright. England and Wales house price data is publicly available information produced by the HM Land Registry.This material was last updated on 9 July 2026. It covers the period from 1 January 1995 to 30 April 2026 and contains property transactions which have been registered during that period. Contains HM Land Registry data © Crown copyright and database right 2026. This data is licensed under the Open Government Licence v3.0.
Disclaimer: Rightmove.co.uk provides this HM Land Registry data "as is". The burden for fitness of the data relies completely with the user and is provided for informational purposes only. No warranty, express or implied, is given relating to the accuracy of content of the HM Land Registry data and Rightmove does not accept any liability for error or omission. If you have found an error with the data or need further information please contact HM Land Registry.
Permitted Use: Viewers of this Information are granted permission to access this Crown copyright material and to download it onto electronic, magnetic, optical or similar storage media provided that such activities are for private research, study or in-house use only. Any other use of the material requires the formal written permission of Land Registry which can be requested from us, and is subject to an additional licence and associated charge.
Rightmove takes no liability for your use of, or reliance on, Rightmove's Instant Valuation due to the limitations of our tracking tool listed here. Use of this tool is taken entirely at your own risk. All rights reserved.